Every Boom Sends a Bill. FY2025's Bill Comes Due Around FY2028
Thirty-two years of SBA 7(a) approval data tell one story again and again. The program doesn't grow so much as lurch: volume doubles in a boom, then halves in a bust. And the loans written at the top of each cycle carry scars that don't show up for two to four years. FY2025 just posted a record dollar year. 78,078 loans, $37.29B, reconciled unit-for-unit to SBA's own FYE25 Activity Report. History says treat that record as a warning light worth watching, not a victory to bank on yet.
BOOM, BUST, REPEAT
Start with the shape of the curve. Every count below is gross approvals by approval fiscal year, the same basis SBA reports officially. Five eras, each one a swing:
- FY1995-2001: declining, then flat. 55.5k loans in FY95 settle into a 42-44k range by decade's end. The program's quiet years.
- FY2002-2007: volume nearly doubles in six years, 52k to just under 100k. The run-up into the housing bubble.
- FY2008-2009: the boom breaks hard, 69k then 41k. A 59% collapse from the FY07 peak in two years.
- FY2010-2020: a slower rebuild. 47k climbs to a FY15-18 plateau of 60-64k, before COVID cuts volume back to 42.3k in FY20, within about a thousand loans of the FY09 trough of 41.3k.
- FY2021-2025: the current run. 52k, 48k, 57k, 70k, and FY25's 78,078. The FY24-to-FY25 step alone is +11.2% by loan count and +19.8% by gross dollars.
FY26's first half is already at 26k. That run-rate reads like a step down from FY25's pace, but it's one half-year against a full-year record. Don't read too much into it either way. SBA's own FY25 release backs up the headline number independently: 77,600 7(a) loans, $37B rounded, part of $44.8B combined with 504 (finalized year-end reports later put the combined figure near $45.1B). Same record this section leads with, confirmed from outside the FOIA file.
WHY THE LAG MATTERS
The charge-off data explains why that volume curve matters. The honest version has two mechanisms, and they're worth separating.
The first mechanism doesn't need a recession to show up. Quality erodes just from being inside a boom. FY2000's cohort, written before the run-up even started, charged off at just 0.22% at three years. By FY2004, three years into the run-up but still fully pre-crisis, that number had already climbed to 2.72%. That pairing alone shows underwriting loosening into the vintages years before any downturn touched them.
The second mechanism is a systemic shock landing inside a fixed measurement window. FY2006's three-year window runs 2006 through 2009. FY2007's runs 2007 through 2010. Both swallow the Great Recession whole, and their charge-off rates, 7.66% and 14.46%, blend boom-era underwriting with a demand and employment shock that hit every cohort seasoning through those years at once. FY2008's cohort, written as growth was already breaking, still came in at 13.02%. In percentage-point terms, the run from 0.22% to 14.46% is a move of roughly 14 points. That's more than 60 times the starting rate, off a very thin base, a multiple sensitive enough to cohort size that it shouldn't carry the argument alone.
The loans written at the top of each cycle carry scars that don't show up for two to four years.
The post-GFC vintages bounced back hard:
- FY2010: 2.47%
- FY2013: 1.31%, the low point of the 2010s rebuild.
- FY2016: 2.33%, a mild re-loosening.
- FY2019: 2.10%
- FY2021: 1.08% at three years, a window that has already closed. Only late charge-off recognition can nudge it now.
- FY2022: 2.69%, the newest completed three-year read and the highest closed reading since FY2009.
The vintages above are a selection, ten benchmarks chosen to mark the turns. The file itself scores every vintage from FY2000 through FY2022 on the same three-year clock, with a partial read on FY2023, and the full series tells the same story without gaps.
THE MISSING YEARS
The right edge of the series deserves the most careful read. FY2022 now has a completed three-year window: 2.69%, the highest closed reading since FY2009. FY2023 sits at 2.63% with roughly half a year still left on its clock. The genuinely missing years are FY2024 and FY2025, the very years that pushed the run from 70k to a record 78,078, and they are simply too young to score.
When loans do go bad, they go bad on a predictable clock. Of roughly 143,000 dated charge-offs in the file, 25,426 hit in year three and 25,202 in year four. The two-to-four-year window absorbs 48.5% of the total, roughly half of all the damage. That clock is exactly why FY24-25 paper deserves attention now. But it's a forecast pulled from older cycles. It is not an observed reading yet. Nobody should describe FY25's vintages as already showing distress. The file doesn't have that number. It arrives, on the program's own clock, somewhere around FY27-29.
THE FINE PRINT
Two structural limits deserve space in the main argument. They don't belong in a footnote.
First, this is approval-level data. Cancelled loans, tagged CANCLD in the file, are excluded from the performance denominators here. The charge-off rates describe loans that funded and matured. They don't cover the full universe SBA approved. Section 03 covers the cancellation rate itself, which set its own record in FY25. Second, FY26 is only a half-year read. And the newest vintage reads come in two kinds: FY2019 through FY2022 are closed three-year windows that can shift only through late charge-off recognition, while FY2023's window stays open into late FY2026, so its 2.63% partial can still climb.
Separately, a basis note. The volume counts in this section are gross approvals, which is why they reconcile to SBA's published history: the officially reported FY24 count of 70,242 is this series' FY24 number, and the FY2015-18 levels here are identical to the gross-approval table in CRS R41146, with earlier years agreeing to within a fraction of a percent. The counts and the charge-off rates are two different universes by design: gross approvals for volume, funded loans for performance. Strip out cancellations and FY25 approved 65,154 loans net of cancellations against FY24's 63,096, growth of 3.3% on that basis against 11.2% gross. Both are true. They answer different questions.
THE BEAR CASE
The strongest attack on this section is that its evidence thins out exactly where the story gets interesting. FY2022 closed its three-year window at 2.69% and FY2023 sits at 2.63% with time still on its clock, early reads that lean the section's way. But the record itself belongs to FY2024-25, and those vintages are too young to score. For the record years, "watch the lag" is a methodological prediction drawn from four prior cycles. It is not a signal already visible in this release, and a skeptical reader is right to demand that distinction.
The second-strongest attack is the recession-timing confound. FY2006-08's elevated charge-offs blend boom-era underwriting with the Great Recession hitting every cohort inside a fixed measurement window at the same time. That's true, and it doesn't erase the thesis: the FY2000-to-FY2004 pairing shows quality already eroding years before the recession touched any cohort. Boom-driven risk-taking is real on its own, independent of whatever the macro cycle does next.
Third, the gross basis flatters the record's growth. Gross approvals count loans that later cancel, and FY25 set the highest cancellation rate in the file at 16.55%. Net of cancellations, FY25 approved 65,154 loans against FY24's 63,096, growth of 3.3% rather than 11.2%. The dollar record survives on either basis; the count surge is partly paper. This section's thesis would be wrong if the FY2023-25 vintage curves settle near the FY2010-13 range (1-2.5%) instead of climbing toward the FY2006-08 range (7-14%). FY2022's completed 2.69% sits just above the calmer band. That is an early lean, and it is a long way from a verdict.
FOR BROKERS
A record placement year proves appetite. It doesn't prove margin, not yet. History says a volume surge this size deserves a harder question: which lenders and which borrower profiles are actually driving the FY24-25 numbers? Section 02 breaks that down by lender. Build your pitch on underwriting discipline inside the boom. Don't build it on the boom itself.
FOR BANKERS
Reserve and stress-test the FY24-25 book against the FY2006-08 charge-off range. Skip the tighter FY2010-13 range: the earliest new reads argue against it, with FY2022 closing at 2.69% and FY2023 already at 2.63% with time left on its clock. Base the assumption on history plus those early reads. Revisit it formally around FY2029, when the two-to-four-year loss window for FY25 paper closes.
WHAT TO WATCH
- The next two quarterly FOIA releases (6/30 and 9/30/2026), which close out FY2023's three-year window. Its partial read stands at 2.63%.
- Whether FY26's full-year total confirms or reverses the 26k H1 run-rate.
- How FY25's record 16.55% cancellation share resolves, and how far it pulls the funded FY25 total below the gross print.
- Section 03's cancellation-rate trend, the other half of the approval-versus-funded story this section's basis note opens.
SOURCES: SBA 7(a)/504 FOIA files (loan-level status as of 3/31/2026), reconciled to SBA FYE25 Activity Report (data as of 9/30/2025) · SBA · "Trump SBA Delivers Record Capital to Small Businesses in FY25", SBA 2025 Annual Report release, CRS R41146 via EveryCRSReport, SBA OIG ROM 10-02 · Recovery Act's Impact on SBA Lending, CFPB Data Point · Small Business Lending and the Great Recession, FRBSF · Cyclicality of SME Lending and Government Involvement in Banks, NBER w23843 · The Decline of Big-Bank Lending to Small Business, Federal Reserve · October 2025 SLOOS.
Every Credit Cycle Leaves the Same Fingerprint. FY2025 Just Left It Again.
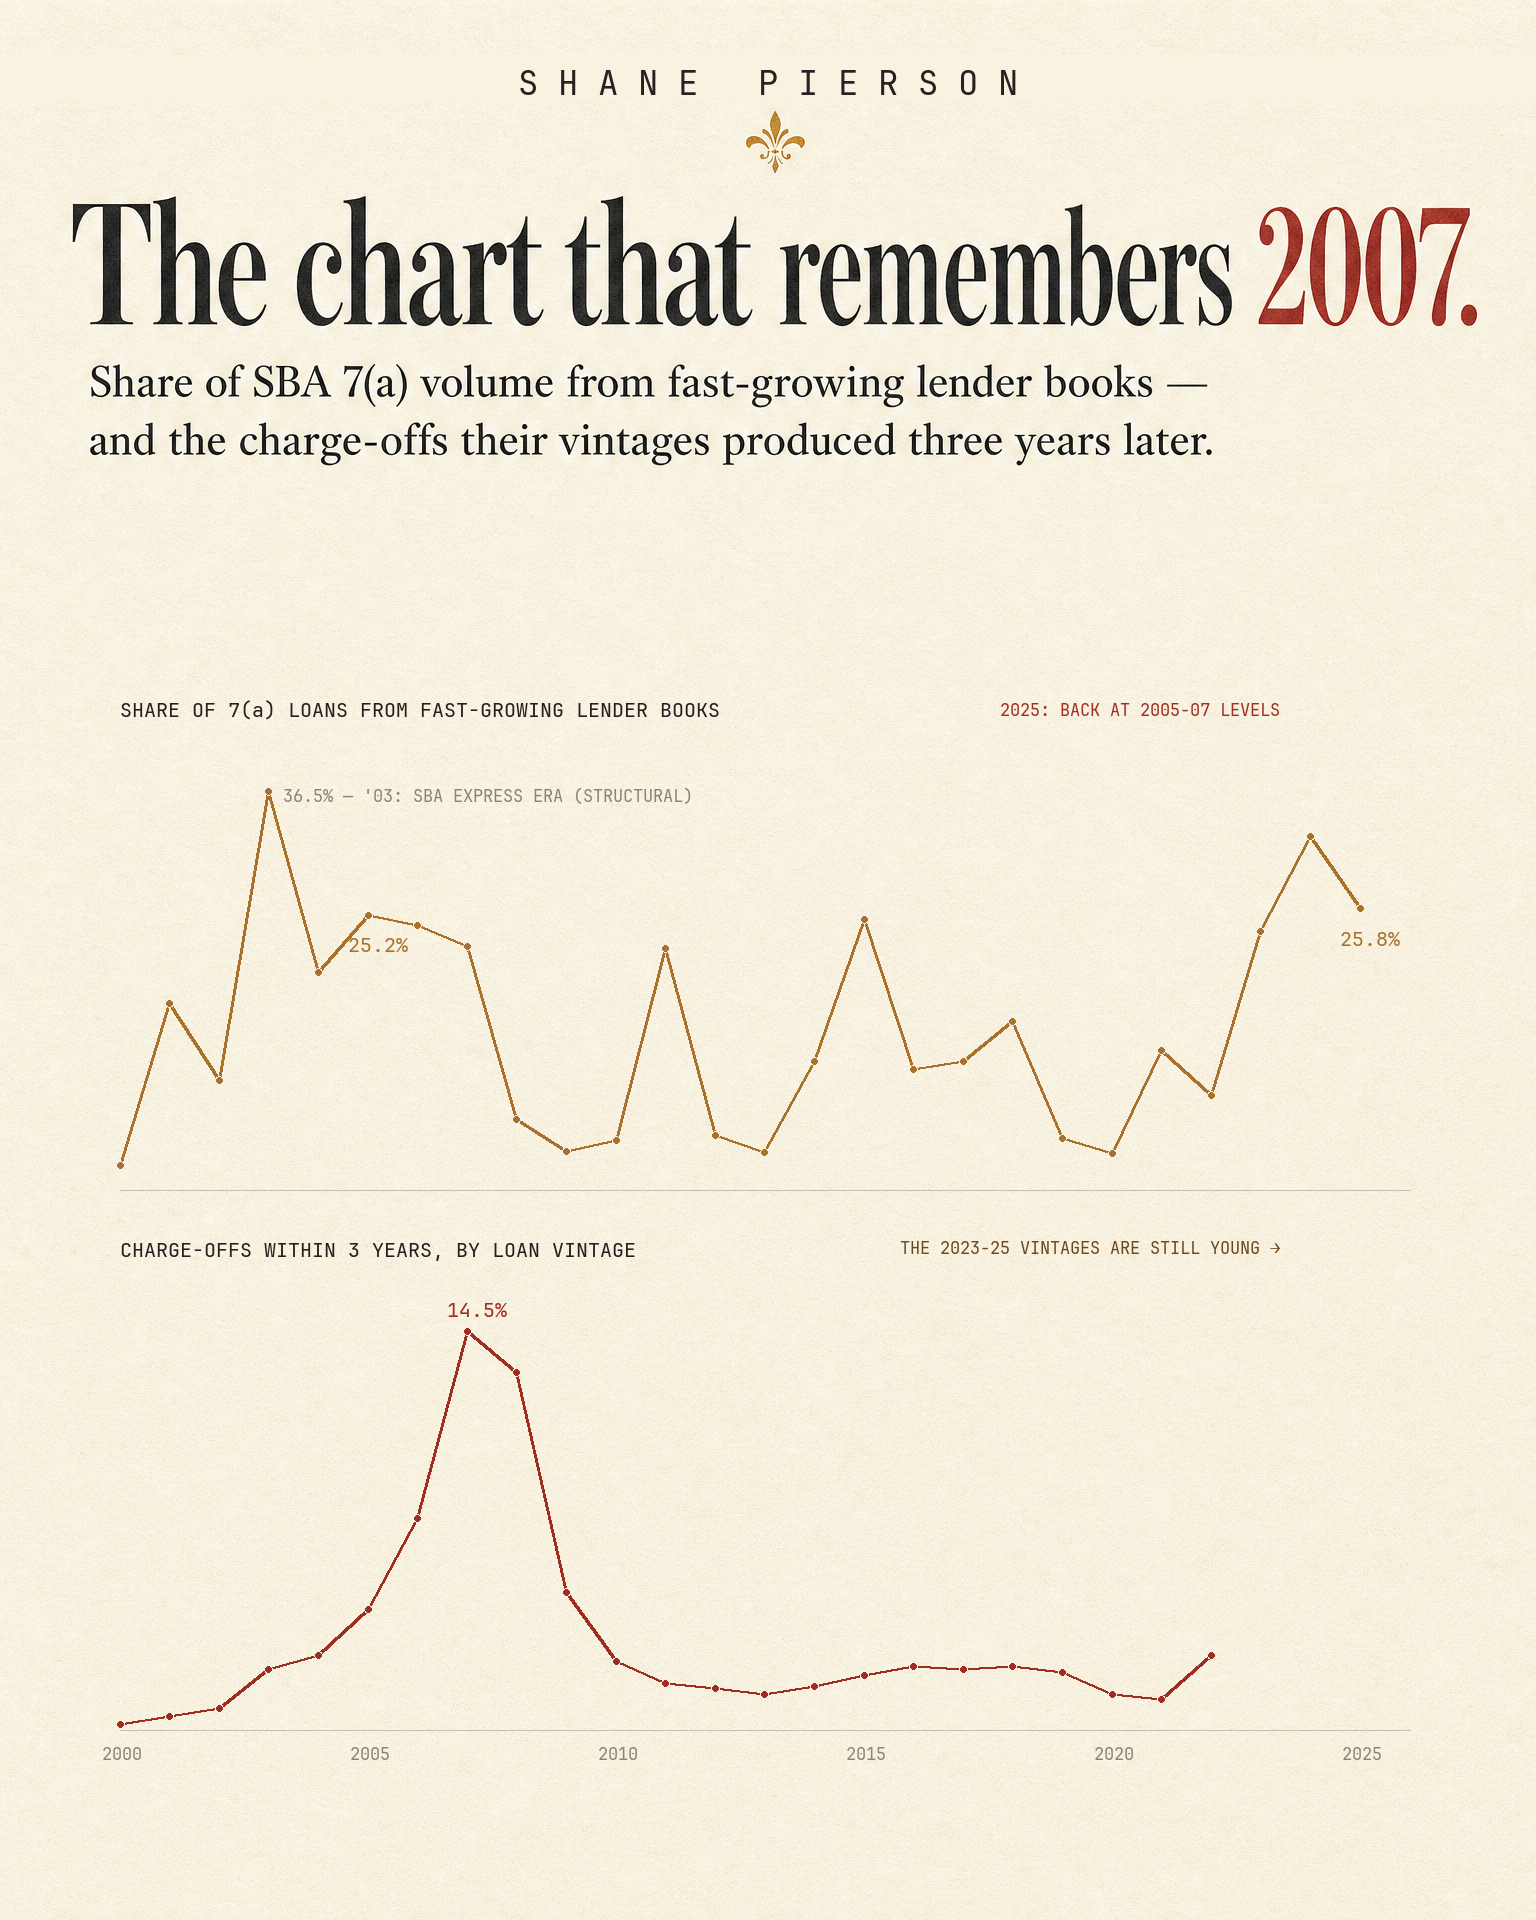
The share of 7(a) loans flowing through lender books that doubled in two years has now run above 20% for three straight fiscal years: 23.7% in FY2023, 32.4% in FY2024, 25.8% in FY2025. Across the twenty-six years the series covers, FY2000 through FY2025, the only other three-year stretch like it is FY2005 through FY2007. The vintage that came out of that run became the worst in the program's thirty-two-year record. This time the setup differs. That does not make it a clean all-clear.
THE FAST-GROWER SHARE
Call it the fast-grower share: the portion of 7(a) loans, counted by loan, originated by lenders whose books expanded faster than underwriting muscle can plausibly season. In FY2005 through FY2007 it ran 25.2%, 24.2%, and 22.3% for three straight years. The FY2007 vintage that came out the other side charged off at 14.46% over three years, the worst cohort on record.
FY2003 is the peak of the series, at 36.5%, and that one was structural. The 2002-03 SBAExpress expansion, which widened a 1995 pilot into a mainline product, was changing who could lend. The metric caught the licensing shift anyway. That is its known blind spot, and it matters again below. Computed for every fiscal year since 2000, the full series then tells a more textured story than a simple quiet decade.
- 4.5% in FY2010 and 3.4% in FY2013, the post-crisis floor
- 22.1% in FY2011 and 24.8% in FY2015, single-year spikes that faded
- 4.7% in FY2019 and 3.3% in FY2020, quiet again
- 23.7%, 32.4%, 25.8% in FY2023-25, the current run
FY2025's 25.8% sits above the top of the 2005-07 band, and it followed FY2024's 32.4%, the highest reading of the modern era. (Dollar-weighted, FY2025's share is 20.5%; the headline series counts loans.) Two caveats belong right next to those numbers. The single-year spikes of FY2011 and FY2015 produced vintages whose three-year charge-offs stayed under 2%, unremarkable for their era, so one hot year proves little on its own. And part of FY2024's peak is the licensing wave described below. What has no post-2007 precedent is the run itself: three consecutive years above 20%.
THE BACKTEST
There is a mechanism behind the analogy, and it comes from the FY2015 spike itself. The 38 lenders whose books doubled between FY2013 and FY2015 produced FY2015-16 vintages that charged off at 9.52%, versus 5.93% across 242 steady-growth lenders, 1.6x worse. Even inside a vintage year that seasoned clean overall, the fast-doubling books paid a penalty. That backtest is the load-bearing evidence for treating the current run as more than coincidence.
It is not yet a clean causal result. One suspect can be cleared: in matured FY2010-19 cohorts, loans through the Express family of delivery methods at or under $350,000 charged off at 6.74% versus 8.35% for comparable non-Express loans, and the flagship SBA Express program alone ran 6.41%, so the Express model is running cooler than its reputation. What Section 8's lender-tier data does show is a handful of high-volume, small-balance originators charging off at roughly two to two and a half times what their sector and size mix predicts, and doubling a book fast is disproportionately a small-ticket, high-velocity exercise. That means "growth degrades underwriting" and "fast growers favor the high-volume small-balance model" are not yet distinguishable in this backtest, which applies no program-mix control. One prior worry can be retired with the cohort now counted: the largest single book holds 48.6% of the fast-grower cohort's loans, and the remaining 14,433 loans still charge off at 10.75%, so no single outlier is doing the work. Fast-growing books charge off worse. This analysis has not proven why.
Fast-growing books charge off worse. This analysis has not proven why.
A LICENSING WAVE
Composition complicates the read too. Part of what is inflating FY2025's number is structural, the same way FY2003 was. The SBA reopened Small Business Lending Company licensing in 2023 after a four-decade moratorium and has chartered a wave of non-bank entrants since.
- Arkansas Capital Corporation, Funding Circle, and Alaska Growth Capital BIDCO in 2023 (Funding Circle has since sold its U.S. unit and no longer holds the license)
- Cooperative Business Services, A10 Capital, Lafayette Square, and Stonehenge Capital in late 2024
- Siemens Small Business Lending in 2026
Fintech-adjacent lender Lendistry jumped from #106 to #28 in the 7(a) dollar rankings between FY2023 and FY2024 in this dataset, measured on approval dollars with cancelled loans and undisbursed commitments excluded; trade site SBALenders.com scores the same climb as #87 to #20 on its own league table. A new charter with little prior-year book to double from will register as "doubled" almost mechanically, and neither the payload nor this analysis states how the metric treats near-zero-base entrants. So licensing expansion accounts for some unknown share of the 25.8%, and of FY2024's 32.4% peak.
That also means FY2025's reading is likely blending two different risk stories into one number. One is a brand-new licensee's early-book, prove-the-license risk. The other is an existing shop stretching its standards to chase volume. The FY2007 mechanism specifically describes the second, and this data cannot currently separate the two.
ONE ADVANTAGE, FADING
The market has one advantage 2005-07 didn't have, though it is already fraying. In a package announced in April 2025 and effective June 1, 2025, the SBA tightened underwriting on several fronts at once.
- Raised the minimum SBSS credit-score floor from 155 to 165
- Cut the 7(a) Small Loan cap from $500,000 to $350,000
- Barred merchant-cash-advance refinancing
- Tightened collateral documentation
It was the most significant underwriting tightening in years, landing in the same fiscal year the fast-grower share reignited. That is a real mitigant the prior episode lacked. It has also already been partially unwound. Effective March 1, 2026, the SBA retired the SBSS prescreen on 7(a) Small Loan applications and replaced it with explicit minimum underwriting standards: a debt service coverage ratio of at least 1.1:1 on historical or projected cash flow, documented credit-history analysis of applicants, associates, and guarantors, collateral descriptions and valuations, and, for lenders that still use scoring, models permitted by their primary federal regulator that do not rely solely on consumer credit scores. That is a real floor. It is also a more discretionary one than the bright-line 165 score it replaced. The loosening has continued since: on May 18, 2026 the SBA announced a doubling of the cumulative 7(a)/504 loan limit to $10 million, effective July 4, 2026. The credit box this section worries about is being re-widened in real time, inside the exact origination window in question.
THE BEAR CASE
The strongest attack on this section is that its causal chain has a hole. The 1.6x backtest never controls for program or product mix. The Express product itself checks out clean (its small-dollar loans charge off less than comparable non-Express paper), yet Section 8 finds a cluster of high-volume small-balance originators running well above their sector-and-size expectation, and fast-doubling books skew toward exactly that origination model. So "fast growth degrades underwriting" and "fast growers favor a hotter model" remain observationally identical here. One old objection is retired: with the cohorts counted (38 fast growers, 242 steady), the largest single book holds 48.6% of the fast-grower loans, and the rest still charge off at 10.75% versus 5.93%, so no lone outlier explains the gap.
Composition is a second real hole. An unknown share of the FY2023-25 run is mechanical: new SBLC charters and fintechs doubling from a near-zero base. New-entrant risk is not the same animal as a mature lender stretching standards, and the metric can't currently split them. The metric also has a false-alarm history: FY2011 and FY2015 both printed above 22% and those vintages seasoned clean. The mitigant has already frayed on schedule. The SBSS prescreen this section once counted on sunset on March 1, 2026, inside the vintage window in question, and the $10 million combined loan limit follows on July 4, 2026.
This thesis would be falsified if the FY2023-25 vintage charge-off curves, readable once FY2027-28 data lands, come in near the FY2019-22 range despite three straight years above 20%. That would mark the current run as another composition story, like FY2011 and FY2015. It would be confirmed, and strengthened, if a program-mix-adjusted rerun of the backtest still shows a growth effect and the FY2025-26 vintage curve tracks toward the FY2005-07 shape now that the SBSS prescreen has lapsed.
FOR BROKERS
Treat a fast-doubling lender relationship as a diligence flag. It doesn't automatically disqualify anyone. Ask directly whether the growth is high-velocity small-balance volume, a new charter building out its book, or an established shop loosening standards. Those three carry different risk, and the public data can't tell them apart yet. And know what changed on March 1, 2026: SBSS prescreening is no longer required on Small Loan applications. The SBA replaced it with minimum standards (a 1.1:1 debt service coverage ratio, documented credit-history analysis, collateral valuation), so ask each lender how it screens small loans now, because the answer varies by shop.
FOR BANKERS
If your book doubled in the trailing two years, this is the moment to ask whether growth was purchased with product mix (more small-dollar, high-velocity paper) rather than credit discipline. The backtest says fast growers charge off 1.6x worse, and this report cannot yet tell you how much of that is you. Budget reserves as if the April 2025 tightening is temporary, because the SBSS prescreen leg of it already sunset in March 2026 and the $10 million combined limit arrives July 4, 2026.
WHAT TO WATCH
The SBSS prescreening sunset for 7(a) Small Loans took effect March 1, 2026. Watch Small Loan approval velocity in the first post-March FOIA quarters (the 6/30/2026 and 9/30/2026 releases) for signs the new minimum standards run looser in practice than on paper.
The FY2025-26 vintage won't have a readable 3-year charge-off curve until FY2027-28 data lands. That is the actual test of this section's thesis.
The remaining methodological gap is a program-mix-adjusted rerun of the fast-grower backtest. The cohort sizes are now on the table (38 fast growers, 242 steady); the mix control is the missing piece.
SOURCES: SBA 7(a)/504 FOIA data as of 3/31/2026, reconciled to SBA's FYE25 Activity Report (fast-grower share, growth-quality backtest) · SBA: SBLC License Applications Reopened, American Banker: SBA Approves New Wave of SBLC 7(a) Lenders, American Banker: SBA's Newly Licensed Nonbank Lenders Will Focus on Growth, Inc.: Siemens SBLC License, Fintech Labs: Top Digital SBA Lenders 2025, FastWaySBA: 7 SBA Rule Changes in 2025, Windsor Advantage: SOP 50 10 8, What the SBSS 165 Increase Means, Nav: SBA to Sunset FICO SBSS for 7(a) Small Loans, SBA: Cumulative 7(a)/504 Loan Limit Doubled to $10 Million
One in Six Approvals Died Before Funding. And the File Can't Say Why.
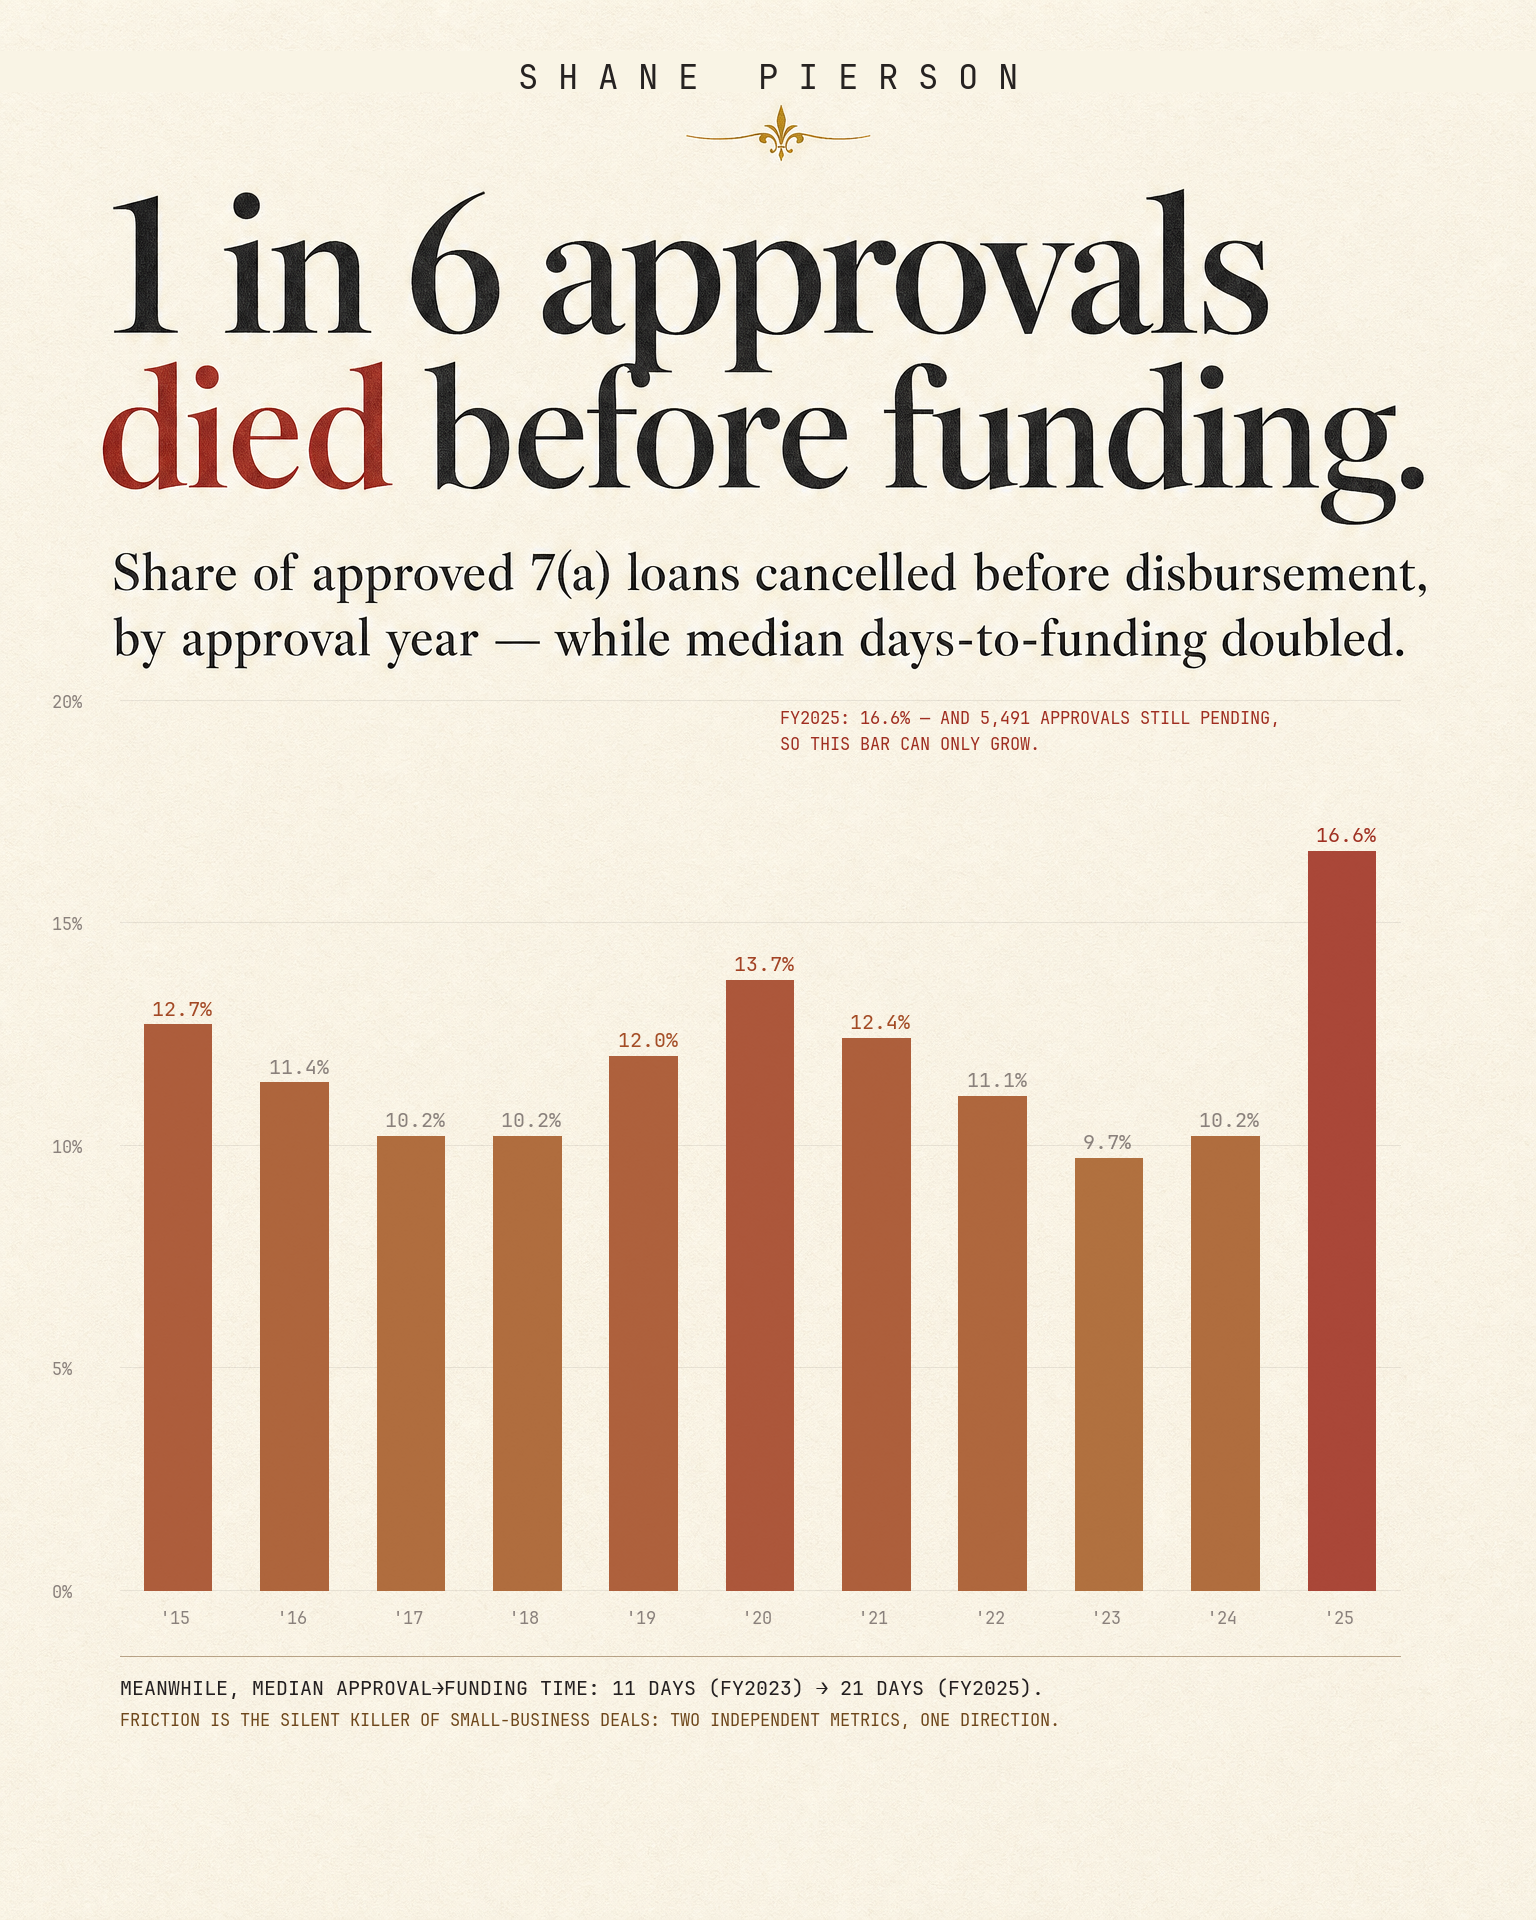
In FY2025, 16.6% of approved 7(a) loans (12,924 loans worth $4.85 billion) never reached the closing table. That is the highest cancellation rate in any fiscal year on record in this file, which reaches back to FY1991, and the true number is still rising. The file does not say what killed them. What it shows is correlation: a fee revision, an underwriting tightening, a record volume year, and a rate environment that, contrary to the obvious story, was easing rather than tightening.
THE GAP WIDENS
Getting an SBA loan approved has never been the hard part. Getting it to the closing table is the harder trick. FY2025's 16.6% blew through the FY2015-24 band of 9.7% to 13.7% by nearly three points, and it cleared the previous all-time peak, FY2010's 15.1%, by almost a point and a half.
That comparison holds up, with one honest caveat. The large majority of cancellations resolve within a year or two of approval, far faster than charge-off, which needs a multi-year horizon to season. The tail runs longer than that: FY2024 approvals, now 18 to 30 months old, still carry 4.6% of their cohort pending. An FY2025 approval is six to eighteen months old at this data's 3/31/2026 cutoff, old enough that the FY2015-24 cohorts are a fair comparison set, and young enough that its own rate can only climb. This is a milder cousin of the right-censoring risk this report flags for younger charge-off cohorts elsewhere.
The number is a floor, not a ceiling. 5,491 FY2025 approvals are still pending as of the cutoff, unresolved to either funded or cancelled. Every one that lapses pushes the final rate higher. It will not land below 16.6%, and if every pending commitment lapsed it would top out at 23.6%.
THE SPEED GAP
Median time from approval to first disbursement stretched from 11 days in FY2023 to 21 days in FY2025. The median time-to-close nearly doubled in two years. One caveat travels with that statistic: a disbursement date is present on 87.4% of FY2023 rows but only 76.4% of FY2025 rows, so some of the widening could be composition, which loans get a date recorded, rather than pipeline speed alone.
That median hides a wide spread. Eastern, Colony, and SouthState carry a 3-day median from approval to funding, while the slow tail runs 30 to 54 days.
The spread is real, but it isn't clean proof of an operational edge. The data reports lender medians, not loan-type-matched pairs. A 3-day median points to a book weighted toward small-dollar, streamlined-underwriting paper. It doesn't have to mean a general efficiency advantage running the same mix as a 30-to-54-day lender.
Some real portion of the ten-to-eighteen-times gap is product mix, not process discipline. How much is a question for a size- and program-adjusted cut of this data that hasn't been run yet.
FOUR SUSPECTS, NO PROOF
What the loan-level data cannot say is why a given loan cancelled. Reason codes aren't a field in the FOIA extract, and that gap sits under every explanation that follows. None of the four candidates below can be proven at the loan level. Each is a national trend correlated in time with a national rate, not a demonstrated cause.
None of the four candidates below can be proven at the loan level.
The easy story, that rates went up and deals fell apart, does not survive contact with the record. The Fed cut rates three times in quick succession late in 2024:
- 50 basis points in September
- 25 basis points in November
- 25 basis points in December
Prime fell from 8.50% to 7.50% by mid-December and held there until a further cut to 7.25% on September 17, 2025, two weeks before the fiscal year closed. Financing got cheaper the same year cancellations spiked, which rules out rate shock as a blanket explanation.
A second candidate sits two sections earlier in this report. FY2025 was also a record approval-volume year, up 11.2% over FY2024 by loan count and 19.8% by gross dollars. A sharp one-year surge is a textbook mechanism for a cancellation bump independent of any policy change. More approvals, including more marginal ones, got pushed through at speed to hit growth targets, and some fraction of those were always going to fall through in underwriting or at the table.
TWO RULES, LATE
Two policy changes hold up better as partial explanations, with one limit: both landed well into the fiscal year, so neither covers loans approved and cancelled in the first half, October 2024 through March 2025.
SBA revised 7(a) fees effective March 24, 2025, returning guaranty and annual service fees to the statutory maximum to protect the program's zero-subsidy status. A fee increase hitting a borrower mid-pipeline, after a deal was already committed at the old schedule, is a plausible mechanism for late-stage cancellation.
Underwriting tightened next, effective June 1, 2025. Three changes landed at once:
- Minimum credit score rose from 155 to 165. That screen has since been retired entirely: SBA discontinued the SBSS prescreen on March 1, 2026 in favor of explicit minimum underwriting requirements (see Section 02).
- The collateral-trigger threshold fell from $500,000 to $50,000, pulling most acquisition deals into collateral requirements that previously didn't apply.
- Equity-injection requirements rose to 10% of project cost for start-ups and change-of-ownership deals.
Independent broker reporting from the same window shows 2025 closings taking longer (one survey found 41% of brokers reporting policy-driven transaction delays, with average time-to-close up 30 days year over year), consistent in direction, if not magnitude, with this dataset's own median lag widening from 11 to 21 days. A 30-day rise in an average close time and a 10-day widening in a median disbursement lag are different statistics measuring related but non-identical things, and the survey isn't scoped specifically to these two rule changes.
At most, fees and underwriting explain the back half of FY2025's spike. The front half needs a different or complementary driver, most plausibly the volume surge above.
THE SHUTDOWN SHADOW
One more factor sits just outside FY2025's boundary but bears directly on what comes next. The federal government shutdown began October 1, 2025 and ran 43 days into mid-November. SBA halted new loan processing entirely, an estimated $170 million a day in blocked lending.
That falls in FY2026, not FY2025. It cannot explain this section's 16.6%. But it lands squarely on the 5,491 FY2025 commitments still pending resolution, and loans frozen mid-pipeline in a payment shutdown are loans at elevated cancellation risk. It previews why FY2026's rate deserves closer scrutiny than FY2025's still-resolving one.
THE BEAR CASE
The strongest attack on this section is that every causal claim in it is an aggregate time-correlation, not loan-level evidence. With no cancellation-reason field in the data, "fees rose in March, cancellations were up in FY25" is a timing coincidence dressed as a mechanism. It's competing against a record volume year and a mid-year rule change that only covers the back half of the fiscal year. It also can't rule out that the lender speed spread is mostly product mix rather than genuine process advantage. This thesis would be falsified if the next quarterly FOIA releases show FY2025's pending commitments and FY2026 cancellations concentrated in loans that entered underwriting before the March 2025 fee change and June 2025 underwriting tightening. That would point to volume growth and general market churn rather than policy as the driver. It would be strengthened if cancellations concentrate in loans underwritten after those dates, and if the lender speed spread survives a size- and program-adjusted rerun.
FOR BROKERS
Set borrower expectations at 21 days as the current median time-to-close. It was 11 not long ago. Flag two rule changes as the ones most likely to kill a deal late if the borrower isn't underwritten for them going in: the collateral-trigger drop to $50,000 and the 10% equity-injection requirement on start-up and change-of-ownership deals. A fast-closing lender relationship (3-day medians) is worth understanding before you chase it. Ask whether the speed comes from process or from a loan mix concentrated in smaller, simpler deals, because that determines whether it will hold on your borrower's file.
FOR BANKERS
Budget for a cancellation rate closer to 17-18% than the 10-13% typical of the last five years, until FY2025's 5,491 pending commitments fully resolve (the historical tail says that runs another year or two) and the FY2026 shutdown overhang clears. Build the underwriting-tightening and fee-revision costs into pipeline forecasting now. Both look like durable rule changes that are here to stay. If your own approval-to-funding lag is running well above the 21-day median, that's a controllable input to your cancellation rate, and a customer-experience metric on top of it.
WHAT TO WATCH
- The next quarterly FOIA release, which will show how many of the 5,491 FY2025 pending commitments funded versus cancelled. That starts resolving this section's headline figure, though the pending tail can take a year or two to clear completely.
- Whether FY2026 cancellations concentrate in loans approved before or after the March/June 2025 rule changes, which would separate the policy story from the volume story.
- The compounding effect of the October and November 2025 shutdown on FY2026's own cancellation rate, given SBA halted new processing entirely for 43 days mid-pipeline.
SOURCES: SBA 7(a) FOIA data as of 3/31/2026, reconciled to SBA's FYE25 Activity Report (cancellation rates, disbursement lag, lender speed spread) · Hartmann Rhodes, The SBA Loan Timeline: What Sellers Need to Know from LOI to Close, ClearlyAcquired, SBA Rule Changes: Impact on Small Business M&A, NAGGL, SBA Announces 7(a) Fee Revisions for Remainder of FY 2025, SBA Information Notice 5000-865775, HSH, Prime Rate History, Federal Reserve, December 18, 2024 FOMC Statement, SBA, Shutdown Blocks SBA from Delivering $5 Billion to Small Businesses, Forbes, How the Government Shutdown Freezes SBA Loans
For the First Time, the Book Shows Where It Actually Hurts
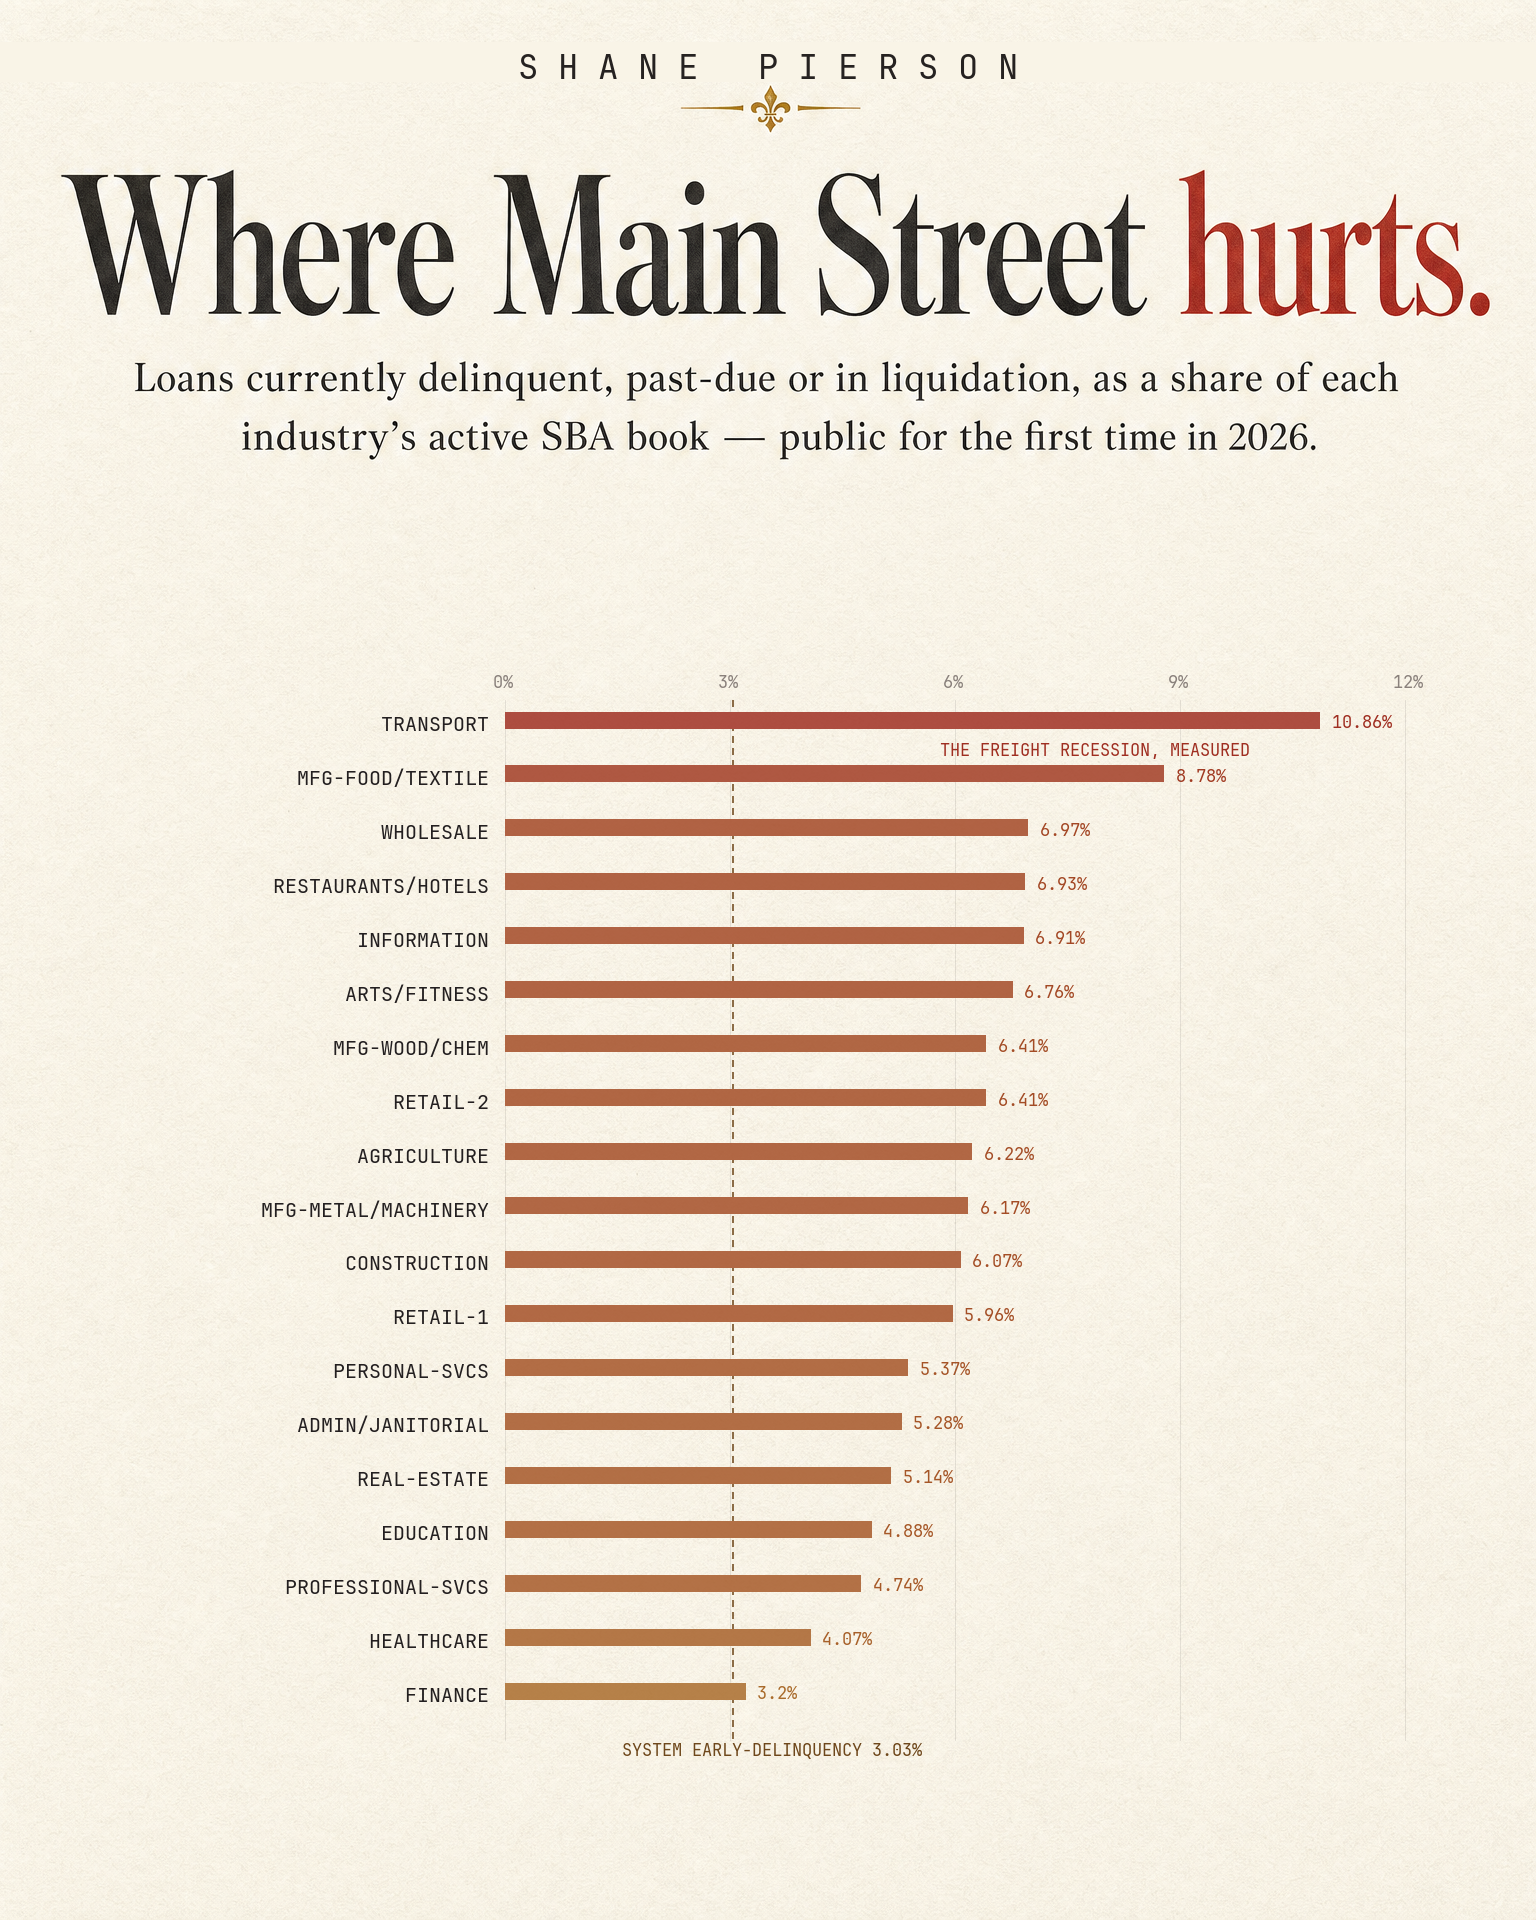
The 3/31/2026 FOIA release is the first to carry loan-level status for every active SBA loan: delinquent, past-due, in-liquidation. Earlier releases only showed the loans that had already failed. This is a single photograph, not yet a movie, and the exposure isn't even. Transportation carries more than three times the distress share of the healthiest sector on the book, and an independent freight-industry data trail lines up with it.
READING THE SPREAD
Prior FOIA releases only showed who'd already gone under. This one shows who's struggling right now, sector by sector, across every loan still active. The share of each sector's active loans sitting in DELINQ, PSTDUE, or LIQUID status ranges from 3.20% in finance to 10.86% in transportation. That's more than triple the healthiest sector on the table. Every distress figure in this section counts loans, unless it says otherwise. Weighted by dollars, the picture shifts: transportation reads 8.15%, finance 2.63%, and food & textile manufacturing moves to the top of the table at 10.58%.
Five sectors round out the stressed tier:
- Food & textile manufacturing at 8.78%
- Wholesale trade at 6.97%
- Restaurants & hotels at 6.93%
- Information at 6.91%
- Arts & fitness at 6.76%
Two things temper how much weight that spread should carry. LIQUID accumulates over years of vintages, so a sector's reading reflects its whole back-book of in-progress workouts, not recent stress alone. And the books being compared differ in size and shape: finance holds roughly 5,000 active loans against transportation's 12,300, and finance and insurance firms rarely need the real-estate- or equipment-secured debt that restaurants or manufacturers do. The 3.20% anchor is statistically stable at that count. What it anchors is a structurally different kind of book.
THE FREIGHT DRAG
Transportation's spot at the top of the table tracks what trade press has been documenting since 2023: a multi-year freight recession. The numbers back it up.
- Freight volumes down roughly 7% year-over-year through Q3 2025 on the Cass shipments index and reporting built on it; ATA's own tonnage index showed far smaller declines, around 0.3-1.5%
- Small-carrier exits estimated at 5,000-8,000 industry-wide in 2025 by one analyst; FMCSA-based counts of net authority revocations ran closer to 20,000, so treat the exit tally as a wide range
- A net contraction of roughly 10,000 carriers recorded in the first half of 2024
A real, independently sourced downturn is pointing at the same sector the loan data flags as worst.
But the SBA's "transportation" category is still broader than the freight carriers the Cass Index tracks. The 10.86% figure is NAICS sector 48, which groups:
- Trucking, about three quarters of the sector's active loans
- Transit and ground passenger operations
- Support activities for transportation
- Air, rail, water, and pipeline
Couriers and last-mile delivery, along with warehousing, sit in a separate group, NAICS 49, running a much lower 5.66% distress share. They are not in the 10.86% figure; folding them in would pull the combined reading to 10.36%.
And the 10.86% figure blends DELINQ, PSTDUE, and LIQUID together. LIQUID alone is about 45% of the sector's distressed loans, so the data can't yet say how much of the number is fresh 2023-25 freight-recession stress and how much is older vintages still working through equipment-heavy liquidations.
What can be said: transportation's rank at the top of the table lines up with the freight downturn, without contradicting it. That's different from saying the SBA book is recording the recession loan by loan, in real time. One more timing note: by spring 2026 the cycle was showing signs of a bottom. Cass shipments were down 4.4% year over year in April 2026 but rising month over month, and Cass projected the index to turn positive in the second half of 2026. Distress in the SBA book lags the freight cycle. It can keep climbing after volumes turn.
THE FROTH SIGNATURE
Arts & fitness is still froth. The distress hasn't caught up to it yet. Its current distress share (6.76%) ranks sixth-highest of the nineteen sectors on the table, upper third, above the 6.17% median. But the sector's annual loan count grew 2.04x from FY2022 to FY2025, 56.9% of its FY2024-25 originations went to startups, unseasoned paper by definition, and it sits on the worst mature-cohort historical baseline in the book: 8.36% charge-off.
The expansion driving that growth is real, and well documented. Chains like Club Pilates added hundreds of new units from 2022-2024, and franchise and PE trade press describes lenders "leaning further into" fitness concepts through 2025.
UNIT ECONOMICS
A widely cited 2023 industry figure put 91.2% of boutique studios as not sustainably profitable at the unit level. By 2024, the same survey lineage shows the profitable share nearly doubling, to roughly 17.4%. The profitability thresholds shift between tellings of that survey, so treat the levels as soft and the direction as the signal. Even read that way, it's a real improvement in unit economics, running alongside continued aggressive expansion, and it cuts against reading the sector as simply "worst baseline, unchanged."
The honest read: a lot of young loans are stacking onto a historically fragile foundation, one that may itself be improving. The FY2024-25 vintage hasn't seasoned into its default window yet, so we don't know which force wins.
THE COUNTER-EXAMPLE
Healthcare is the cleanest counter-example among the fast growers, with a caveat about the comparison itself. Its annual loan count grew 1.79x, and its all-in distress reading of 4.07% (DELINQ+PSTDUE+LIQUID) tracks close to its own historical mature-cohort baseline of 4.09%. That's growth without visible credit-quality erosion. Finance posts lower readings still, 3.20% against a 3.97% baseline, but finance barely grew (1.37x); healthcare is the sector that grew hard and stayed clean.
That reading isn't directly comparable to the system-wide early-delinquency figure of 3.03%, which excludes LIQUID entirely. Computed the same LIQUID-free way, healthcare runs 2.22%, below the system rate; the two constructions describe overlapping but different things, so keep them in separate columns.
The cleaner finding is the contrast with arts & fitness. Growth alone doesn't predict distress. Growth stacked on a bad historical baseline does.
THE OUTSIDE BENCHMARK
On the 3.03% system-wide early-delinquency reading, outside benchmarks offer a directional anchor, not proof. Equifax's Small Business Delinquency Index put state-level 31-90-day delinquency as high as 3.0% (Florida) as of November 2025, with most states running lower. The SBA book's 3.03% sits at or above that top end.
One plausible reading, consistent with this report's broader release-valve framing, is that the SBA program is by design absorbing marginal borrowers that conventional lenders decline, and so runs hotter than the general small-business population. That reading isn't proven here. DELINQ+PSTDUE and Equifax's 31-90-day bucket are built from different populations and different definitions, and no single authoritative series measures both the same way.
THE BEAR CASE
This is one photograph. It isn't a trend line yet. The release combines a slow-moving LIQUID back-book with fresh DELINQ/PSTDUE stress, so transportation's 10.86% can't be decomposed into "freight recession happening now" versus "older vintages finishing a multi-year workout." Trucking dominates the SBA grouping, but transit, passenger operations, and support activities ride inside the same number, and the freight cycle itself was showing a bottom by spring 2026.
The whole table is counted in loans. Weighted by dollars, the spread narrows and the ranking shifts, with food & textile manufacturing moving to the top. The lowest reading, finance at 3.20%, sits on roughly 5,000 active loans, a stable base but a smaller and structurally different book than transportation's 12,300. The 3.03% system-wide comparison to outside delinquency benchmarks uses two differently defined measures, DELINQ+PSTDUE versus a 31-90-day bucket, built from different borrower populations. Call it directional, not exact.
This thesis falls apart under two conditions. First: the next quarterly FOIA release shows transportation's flow-based (newly delinquent) rate falling in line with the mid-pack sectors, meaning today's reading is mostly inherited back-book liquidation, not an active freight-recession signal. Second: arts & fitness's FY2024-25 vintage seasons into low, not elevated, default rates, meaning the froth resolved into durable growth rather than stacked risk.
FOR BROKERS
Underwrite transportation deals, especially long-haul trucking and equipment-heavy carriers, on the assumption that borrower distress outlasts the freight cycle. Volumes were bottoming by spring 2026 while the SBA book's reading was still the worst on the table. Press for current fleet utilization and receivables aging rather than relying on the sector's average distress reading. On arts & fitness, treat strong loan growth as a flag to dig into unit-level profitability and franchisor support, not a green light. The loans that look fine today are the ones too young to have shown what they'll do.
FOR BANKERS
Don't size sector risk reserves off this single snapshot's raw percentages. The shares here are loan counts; dollar-weighting changes both the spread and the ranking, so check exposure on both bases before treating any sector's reading as a reserve input. Flag arts & fitness and transportation for closer portfolio monitoring ahead of the next FOIA release. That release is the first real chance to see whether these are rising, falling, or holding flat, rather than one-time readings.
WHAT TO WATCH
Watch the next quarterly SBA FOIA release, the first to allow a genuine flow comparison against 3/31/2026. Specifically: whether transportation's newly-delinquent rate is still rising or has begun reverting toward the sector median, and whether arts & fitness's FY2024-25 startup cohort starts showing elevated early delinquency as it crosses the 12-18 month seasoning mark. Also watch whether the freight bottom holds: early 2025 tonnage upticks faded, but by April 2026 Cass shipments were rising month over month and Cass projected positive year-over-year readings in the second half of 2026. If volumes recover while SBA-book distress keeps climbing, that's the lagging-indicator pattern this section expects. And watch whether boutique-fitness unit economics keep improving from the 2023 lows.
SOURCES: SBA 7(a)/504 FOIA loan-level data, 3/31/2026 release (status-detail fields) · Cass Freight Index, Cass Transportation Index Report, April 2026, FRED / Cass shipments series, FleetOwner on the freight cycle, Luna Logistics on 2025 carrier bankruptcies, Athletech News on boutique fitness, Franchise Times on lender/PE interest in fitness, Equifax Small Business Delinquency Index, Equifax November 2025 newsroom release.
Same Program. Same Decade. An 87x Gap Between Franchise Brands.
An SBA-guaranteed loan is the same instrument no matter whose name sits on the storefront. It carries the same guaranty structure, the same 7(a) underwriting spine, the same government backstop. The brand on the door is not supposed to be a credit variable. In the matured FY2010-19 loan book, it is one of the largest.
THE 87X GAP
Start with every franchise brand that logged at least 150 matured SBA loans between FY2010-19. That window is old enough for the cohort to run its full three-to-five-year charge-off clock, and recent enough to still describe how the program runs today. Merge the brand variants, the co-brands and regional DBAs, into a single line, and forty-five brands clear the bar, spanning 12,767 loans.
SBA loans to Ameriprise Financial franchisees charged off at 0.34%. SBA loans to Dickey's Barbecue Pit franchisees charged off at 29.65% (Wilson 95% CI 23.3%-36.9%). By point estimate, that's an 87x spread on the same government-guaranteed product, underwritten under the same program rules, in the same decade.
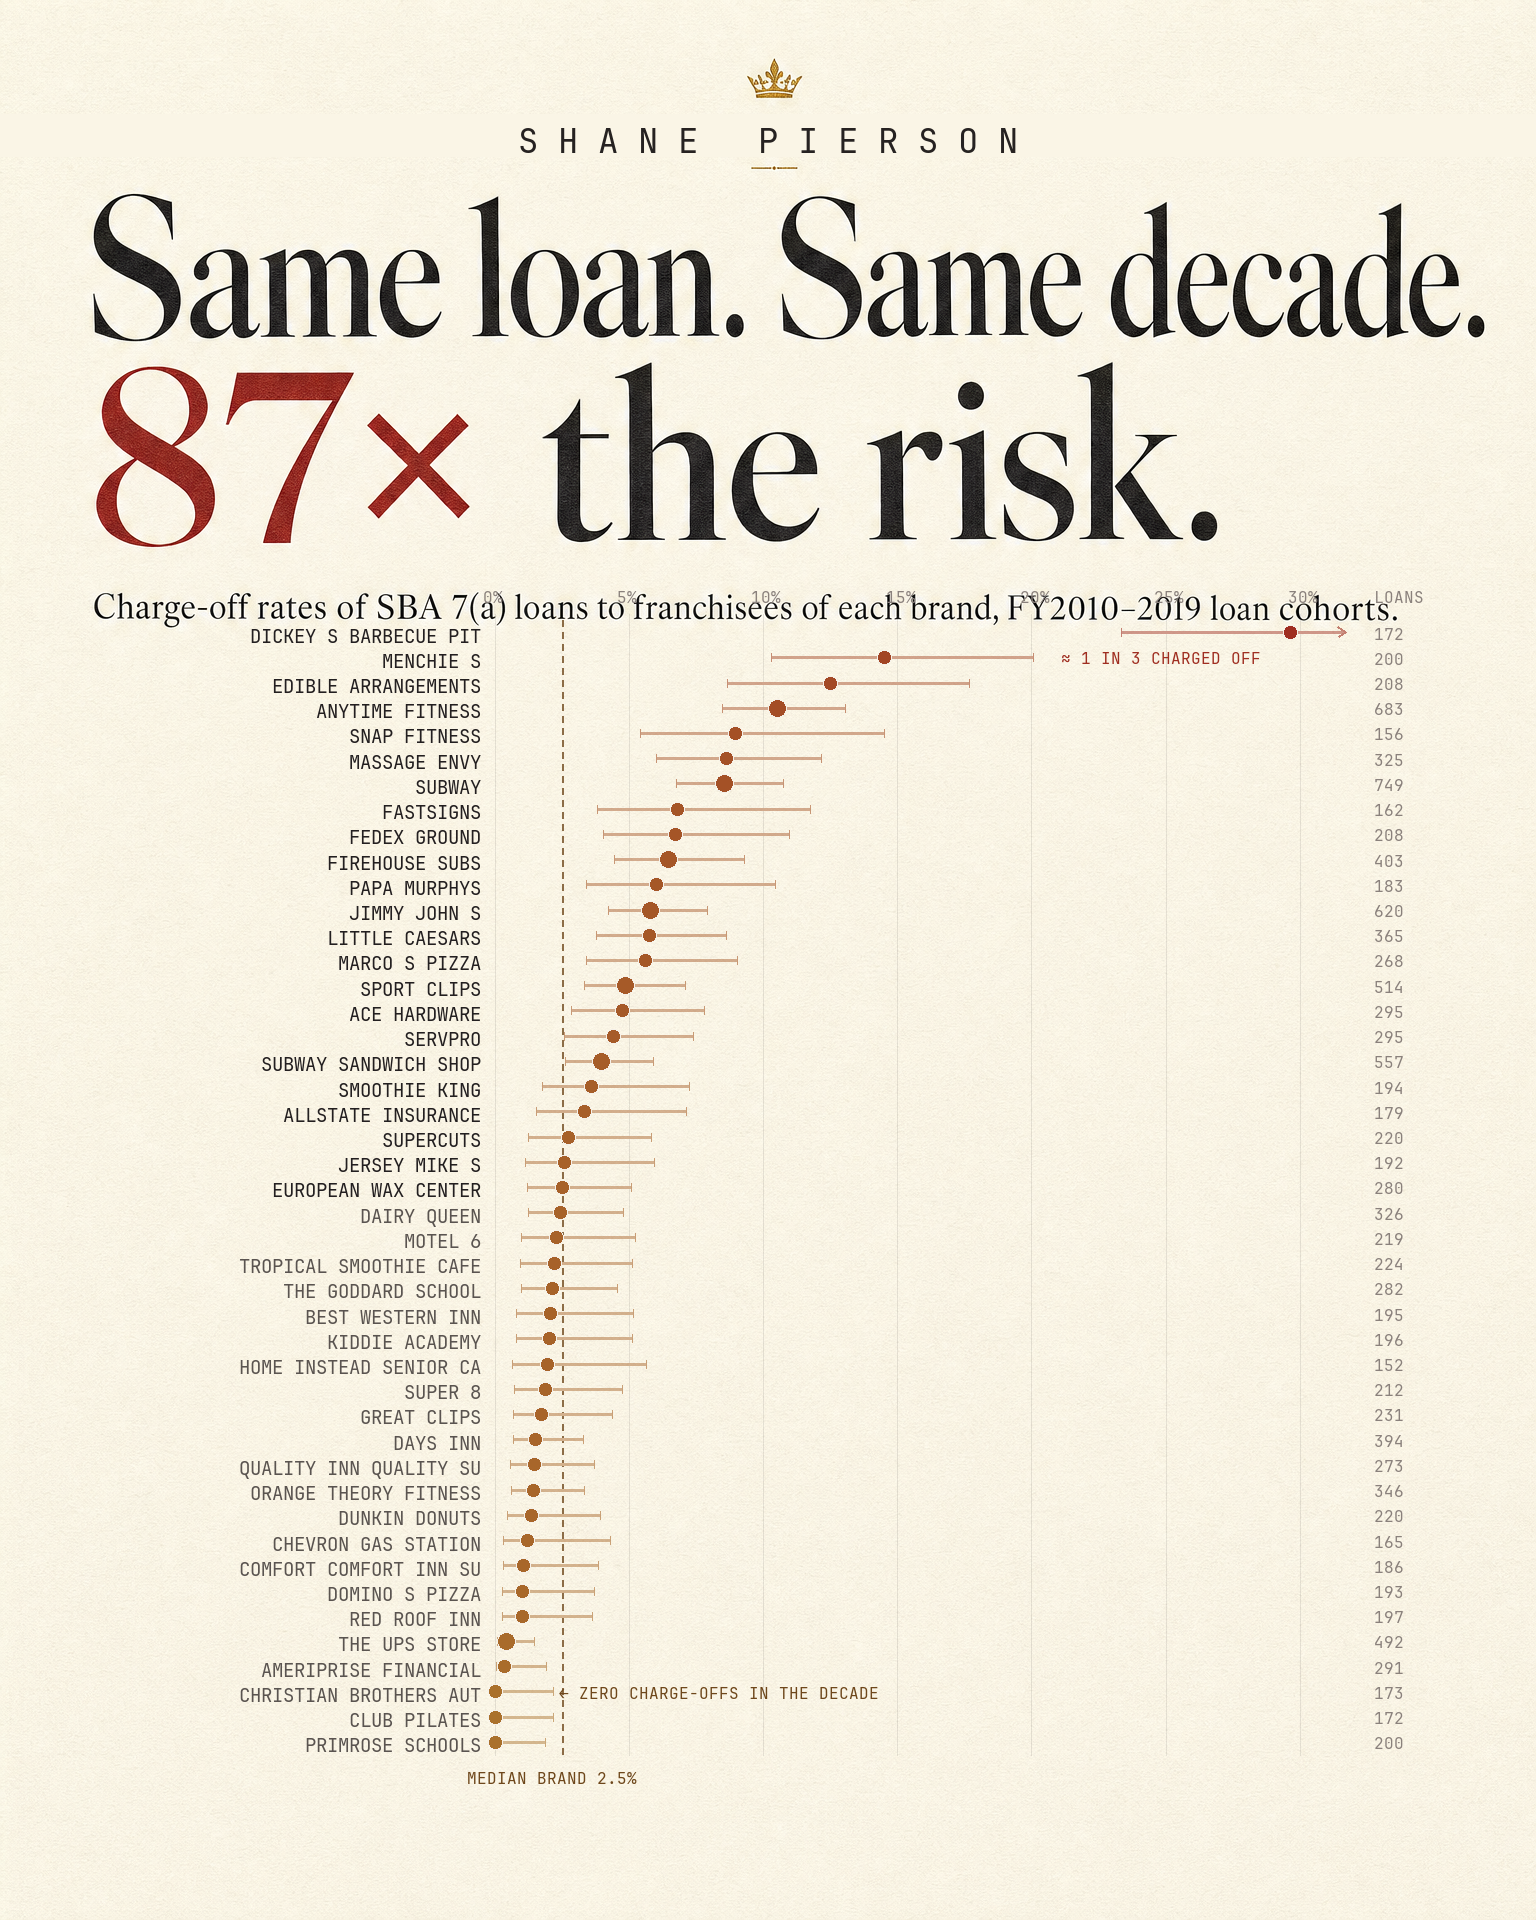
That headline ratio deserves a gut check. Ameriprise and Dickey's are the two most extreme values picked out of 45 ranked brands, and a ratio of selected extremes flatters itself. It also leans on a very small count of events at the low end. The 0.34% rate is a single charge-off in 291 loans, so one more or fewer would swing the multiple materially. Hold both brands to their Wilson 95% bounds instead, Dickey's lower bound of 23.3% against Ameriprise's upper bound of 1.9%, and the gap still runs at least about 12x. The steadiest comparison is simpler yet. Dickey's charged off at roughly 12x the 45-brand median of 2.5%.
READ THE CAVEATS
One caveat belongs up front. A charge-off is a loan outcome. It does not prove a franchisee's business failed. It can reflect a location that sold to a new owner, a workout short of failure, or a closure that had nothing to do with insolvency. Read every rate in this exhibit as "SBA loans to franchisees of X." That is a description, not a verdict on the brand itself.
Three brands post no charge-offs across a real sample. That's a strong result across a full decade, including the 2015-16 energy-patch slowdown and the front half of COVID.
- Christian Brothers Automotive franchisees, n=173, zero charge-offs
- Club Pilates franchisees, n=172, zero charge-offs
- Primrose Schools franchisees, n=200, zero charge-offs
But at this sample size, a 0-of-n outcome carries a Wilson 95% upper bound of roughly 2%, not a proven zero floor. Read it as no charge-offs observed, with the true rate plausibly as high as about 2%, comparable to several mid-pack brands elsewhere in the exhibit. It is not yet a durable structural fact about the business model.
FITNESS, TWO WAYS
The most useful finding in this exhibit is what turns up when the sector holds constant and the model is allowed to vary. Fitness shows up at both poles at once.
- Anytime Fitness franchisees charged off at 10.54% (CI 8.5%-13.1%)
- Snap Fitness franchisees charged off at 8.97%
- Orangetheory franchisees charged off at 1.45%
- Club Pilates franchisees charged off at effectively 0%
All four file under "fitness."
By point estimate, this is an 87x spread on the same government-guaranteed product, underwritten under the same program rules, in the same decade.
The pattern lines up with a plausible mechanism. Anytime and Snap run the compact 24/7 convenience-club format, roughly 3,000-6,000 square feet, keyless around-the-clock access, mid-tier monthly dues, equipment overhead against thin per-member margin, a model engineered for low real-estate and staffing costs. Orangetheory and Club Pilates run boutique formats, higher ticket, class-based, often prepaid, with a different capital structure entirely. That said, this is four data points in one sector, inside a cohort that straddles COVID. Brick-and-mortar gyms of every format sat through extended pandemic shutdowns, and a dues-based membership model bleeds recurring revenue for every month the doors stay shut. The data cannot fully separate a genuine model effect from a COVID-exposure effect that happens to correlate with the model. Treat "model beats sector" as a real pattern within fitness in this decade, not yet a proven, portable law for the whole 45-brand universe.
THE SELECTION FILTER
There's a second, quieter caveat behind all 45 brands. Clearing the N>=150 threshold is itself a filter. Only large, persistent franchise systems that kept attracting new SBA-financed franchisees across a full decade can appear in this exhibit. A brand that struggled and shrank early would simply never reach the floor. It would be invisible here rather than showing up as a bad performer. Dickey's clearing the bar despite documented distress stands out. It kept getting SBA-financed franchisees through the exact window it was struggling. But it means the 2.5% median describes the "big and durable enough to get counted" tier of franchising, not a random sample of the franchise universe. Whatever risk story exists among the smaller, less durable brands below the floor stays unmeasured here.
THE NEXT DICKEY'S
On top of the historical ledger sits a live momentum read. FY24-25 SBA funding growth by brand tells its own story.
- GameDay Men's Health, up 47x
- The Back Nine, up 20x
- Bricks & Minifigs, up 9x
- Woof Gang, up 4.7x
None of these brands sit in the FY2010-19 matured cohort. They're too new to have a charge-off track record inside this dataset, which is exactly why they belong on a watchlist rather than in the ledger itself. The ledger shows what happened to the franchise system underneath yesterday's fast-growing brand. Dickey's was itself still expanding inventory through the mid-2010s before its footprint began contracting after 2018. The momentum column shows which brands are candidates for tomorrow's version of that story. Whether GameDay lands near Ameriprise or near Dickey's is exactly the question this same ledger will answer once its own loans mature. Not now.
THE BEAR CASE
The headline 87x figure is real by point estimate, but it's statistically fragile. It divides by a near-zero rate anchored on a single Ameriprise charge-off, and both poles are the selected extremes of 45 ranked comparisons. The more defensible numbers are the roughly 12x floor that survives at the Wilson bounds and Dickey's running roughly 12x the field median. The "clean zero" brands aren't proven zeros. At n=170-200, the true rate could plausibly run as high as about 2%. The within-fitness model split (convenience-club vs. boutique) is drawn from four brands in one sector, inside a cohort that straddles COVID, so it can't yet be separated from a COVID-exposure confound. It shouldn't be read as a portable rule across the other 41 brands. Independent trade coverage does back up the Dickey's number as a real, well-documented brand crisis. More than 170 locations closed from 2018 onward, and a 2019 franchise-disclosure analysis found Dickey's led its peer set in litigation. That same coverage cuts the other way for using 29.65% as a forward-looking estimate. The footprint has since visibly contracted, so the number describes 2010-19 Dickey's, not a 2026 Dickey's loan. On the momentum brands, independent trade coverage confirms GameDay's expansion is real. Founded in 2018, it opened its 100th location in September 2024 and passed 300 by mid-2025. Franchise-broker profiles put its 2023 unit growth near 14x, a figure that traces to sales-side sites rather than hard trade press, and even taken at face value it sits well below the SBA-funding 47x. The two run on different clocks (calendar-year units vs. FY24-25 SBA loan counts) and diverge rather than match, which raises an open question about deal size per unit rather than resolving one. This thesis would fail a check if a loan-level rerun controlling for vintage and sector collapses most of the spread, or if the FY26-27 FOIA release shows GameDay-tier momentum brands seasoning into charge-off rates near the field median rather than near Dickey's. It would be strengthened if the model-vs-sector split holds up in a non-fitness sector with a similarly wide range.
FOR BROKERS
A brand's credit signal sits in the model underneath it, not in the name on the door. Before placing a franchise deal, ask what format and capital structure the brand actually runs (dues-based vs. prepaid, real-estate carry, unit economics), and don't stop at the sector code it files under. Two brands in the same sector can sit five to seven times apart even after granting the low pole its full confidence bound. Treat momentum brands like GameDay as unproven, not disqualified. The growth is real by two independent measures, but there is no charge-off track record yet to underwrite against.
FOR BANKERS
If your franchise book concentrates in a brand near this exhibit's high end, don't read the rate as a verdict on today's version of that brand. Check whether the footprint and franchise-support model have changed since the FY2010-19 vintage, the way Dickey's demonstrably has. Treat every "zero charge-off" brand's reserve policy with the Wilson upper bound in mind, not the point estimate. A 0-of-170 result is a good outcome, not a guarantee.
WHAT TO WATCH
The next quarterly FOIA release will begin to show whether FY20-21 franchise vintages, including any post-2019 Dickey's loans, charge off differently than the FY2010-19 cohort documented here. SBA's franchise-eligibility infrastructure has just completed a full round trip. SBA eliminated its Franchise Directory in 2023, FRANdata's private Franchise Registry filled the gap for two years, and SBA then reinstated the Directory effective June 1, 2025 under SOP 50 10 8. Lenders once again verify franchise eligibility against the SBA Franchise Directory itself, and the June 30, 2026 deadline for the mandatory Franchisor Certification has now passed. Brands that failed to certify are being removed from the Directory, so some could disappear from future FOIA cohorts for eligibility reasons, not credit performance. Watch too whether GameDay Men's Health and the other momentum brands begin generating enough matured loan volume to enter a future version of this exhibit. That's the only way to know if 47x funding growth becomes an Ameriprise or a Dickey's.
SOURCES: SBA 7(a)/504 FOIA data as of 3/31/2026, reconciled to SBA's FYE25 Activity Report (franchise-level charge-off cohorts, FY2010-19 matured, N>=150, variant-merged, Wilson CIs) · Franchise Times: franchisee complaints continue at Dickey's, Restaurant Dive: Dickey's franchisees sue over inflated projections, Restaurant Business: Dickey's sales plunge, franchisees pay the price, SBA: Franchise Directory, Taft Law: SBA Franchise Directory reinstated effective June 1, 2025, FRANdata: SBA extends franchise certification deadline, FRANdata: SBA proposes elimination of franchise directory, FranchiseWire: GameDay Men's Health reaches 100-unit threshold, PRWeb: GameDay's 100th franchise location, BusinessWire: GameDay expands to Canada
The Rate You're Quoted Predicts Your Charge-Off Risk
Inside the FOIA data, the interest rate on an SBA 7(a) note works like an early warning that resolves years later as a charge-off. Borrowers quoted the highest initial rate in a same-size, same-vintage cohort charge off at nearly four times the rate of borrowers quoted the lowest. That gradient is clean and monotonic across 56,000 loans. Whether that means lenders are pricing risk they can already see, or something else is doing the work, is a real open question. This section does not pretend to settle it.
Start with the mechanics behind the number. SBA variable-rate 7(a) pricing is a base rate plus a lender spread, and that spread compresses and expands with the credit cycle, the same way corporate loan spreads do. Joined to FRED's Prime series at the month of approval, the median variable-rate spread moved like this:
- FY2012: +2.75 points over Prime
- FY2018: +2.60
- FY2021: +2.25, the bottom, during the cheap-money years
- FY2024-26: back up to +2.75
That's roughly where the spread sat in FY2012, and 15 basis points above where it sat in FY2018. It hasn't reverted cleanly to one stable pre-2021 baseline. With Prime at 6.75% today, that spread history alone explains a meaningful share of why borrowers are paying more for the same guaranty than they were three years ago. It's a market-wide repricing. It has nothing to do with a change in who SBA is lending to.
THE QUARTILE TEST
Underneath that market-level spread sits the section's strongest evidence. Take FY2013-17 variable-rate loans in the $150k-500k band, narrow enough that loan size is controlled, and sort them by initial rate into quartiles. Charge-off is a matured, final-outcome measure of loan performance. (A charge-off isn't proof the underlying business failed. The loan can be sold, refinanced, or restructured while the borrower's business keeps running.) Here's what happens quartile over quartile, across 56,000 loans, with no reversals in between:
- Quartile 1: 3.4% charge-off
- Quartile 2: 5.1%
- Quartile 3: 10.2%
- Quartile 4: 12.8%
Quartile 4 borrowers charge off at 3.8x the rate of quartile 1. One reproducibility note on the decimals: 7(a) rates cluster at quarter-point marks, so thousands of tied loans straddle each quartile boundary and individual quartile values can shift by a few tenths of a point from one run of the sort to the next. The ordering never changes, and the top-to-bottom ratio lands between roughly 3.7x and 3.9x in every rerun.
Quartile 4 borrowers charge off at close to four times the rate of quartile 1.
This isn't a randomized test. Fixed- and variable-rate, high- and low-rate borrowers differ by lender and program as much as by underlying risk. A separate finding elsewhere in this report (Section 08) shows high-volume small-balance lenders running structurally higher charge-off than their sector/size/program mix predicts. If those lenders' loans cluster in the top rate quartiles here, part of this gradient is a lender-identity effect layered on top of, or instead of, borrower-level risk pricing. The data alone can't fully separate the two.
A DIFFERENT STORY
There's a related but different data point worth flagging on its own. In the 2021-22 cohorts ($150k-2M), variable-rate loans sit in bad status today (delinquent, past due, in liquidation, charged off, or with the guaranty purchased and not yet charged off) at 10.9%, versus 4.6% for fixed-rate loans in the same window. That's a 2.4x gap.
It's tempting to read this as a second confirmation of the quartile story. The mechanism is probably different, and it shouldn't be folded in as if it were the same evidence. Fixed- and variable-rate borrowers also self-select on term, collateral, and lender mix, so some share of the gap reflects who chooses each structure in the first place. Beyond that, the 2021-22 variable-rate originations sat directly in the path of the fastest Fed hiking cycle in four decades. A real share of that gap is a post-origination payment shock these borrowers never signed up for, not a risk read priced in at approval. This number hasn't matured yet either: these cohorts are only four to five years seasoned, and this report's own vintage curves show recent vintages understating their eventual charge-off simply because they haven't finished seasoning. Treat 2.4x as suggestive and likely to move, not as a settled number carrying the same weight as the matured 3.8x quartile spread.
PRICING TODAY
Here's where that leaves current pricing. The FY2025-26 size grid runs from a 10.5% median for loans under $150k down to 8.75% for loans over $2M, a 175 basis-point spread by size alone.
Some of that is regulatory. SBA's own maximum-rate rules, size-based since a June 2022 amendment, give lenders far more room on small loans than on large ones:
- Prime + 6.5 points on loans of $50k or less
- Prime + 6.0 from $50k to $250k, and Prime + 4.5 from $250k to $350k
- Prime + 3.0 on loans over $350k, the lowest cap in the schedule
- A cap band of 9.75%-13.25% at today's Prime
But the observed grid sits well inside that envelope. It isn't pressed up against it. The $2M+ median (8.75%) runs a full point below even the lowest cap in the schedule (Prime + 3.0, or 9.75% today), and the top of the grid (10.5%) sits 2.75 points under the small-loan ceiling. Regulation sets the outer bounds. It doesn't explain the gradient lenders actually chose within them, and the quartile test already controlled for size and still found a 3.8x spread. A genuine risk-pricing indicator survives on top of whatever the caps allow.
THE BEAR CASE
The sharpest attack still standing is this: the quartile pattern may owe more to lender and program mix than to marginal borrower risk, which would undercut the rate-predicts-risk framing this section leans on. This report's own lender-dispersion analysis (Section 08) shows high-volume small-balance lenders running 2.0-2.6x their sector/size/program-adjusted expectation, figures that describe historical FOIA loan cohorts in each lender's assigned book rather than any institution's current condition. At least one of those lenders also prices hard against the regulatory ceiling: on variable-rate loans since FY2024, BayFirst's median gap to its size-tier cap is 1.25 points, with 91.6% of its loans priced within 150 basis points of the cap, against a market median gap of 2.0 points. If loans like those cluster in the top rate quartiles here, the monotonic pattern is partly a lender-identity effect riding alongside true risk pricing, not proof that a marginal dollar of quoted rate maps to marginal risk within a single lender's book. Separately, the 2021-22 fixed-versus-variable gap is as much a payment-shock story as a pricing-at-approval story, and it is still unmatured. It could narrow or widen materially by the time these cohorts finish seasoning. This case would weaken considerably if a within-lender or within-program re-run of the quartile test collapsed most of the spread, or if the 2021-22 gap converges toward parity with fixed-rate loans as the cohort matures.
FOR BROKERS
A borrower quoted well above the size-grid median is paying for something beyond size. The data says the lender is pricing them as a worse risk, and quartile 4 borrowers charge off at nearly 4x quartile 1. That read is real even if it isn't purely about the borrower. Check who is doing the pricing before you assume it's all borrower-driven.
FOR BANKERS
The size grid you price off has real regulatory headroom built in, especially on small loans. The market isn't using all of it, and the quartile evidence suggests that gap isn't an accident. It looks deliberate. Variable-rate borrowers from the 2021-22 vintages are carrying a rate-hiking shock on top of the ordinary risk premium, and that book deserves its own monitoring, separate from a pure credit-risk lens.
WHAT TO WATCH
- The next quarterly SBA FOIA release, for whether the 2021-22 fixed/variable gap narrows or widens as that cohort finishes seasoning.
- Adoption of SBA's alternative base-rate options (SOFR plus the 5- and 10-year Treasury notes, effective March 1, 2026 and available now), which could fragment the Prime-indexed spread series this section relies on within a year or two. The maximum rate on those loans stays anchored to Prime plus the size-based spread, so the cap analysis above still applies.
- Any within-lender or within-program re-cut of the quartile data that would isolate borrower-level risk pricing from the lender-mix effect flagged above.
SOURCES: SBA 7(a)/504 FOIA data as of 3/31/2026, reconciled to SBA's FYE25 Activity Report, joined to FRED MPRIME · Bay Street Lending: Current SBA 7(a) Loan Rates, SBA.gov: Terms, Conditions, and Eligibility, Crestmont Capital: SBA Loan Interest Rate Trends, Crestmont Capital: SBA Loan Default Rates by Industry, Federal Register: 7(a) Alternative Base Rate Options, GoSBA Loans: Current SBA Loan Rates Today.
First the Boom, Then the Bill
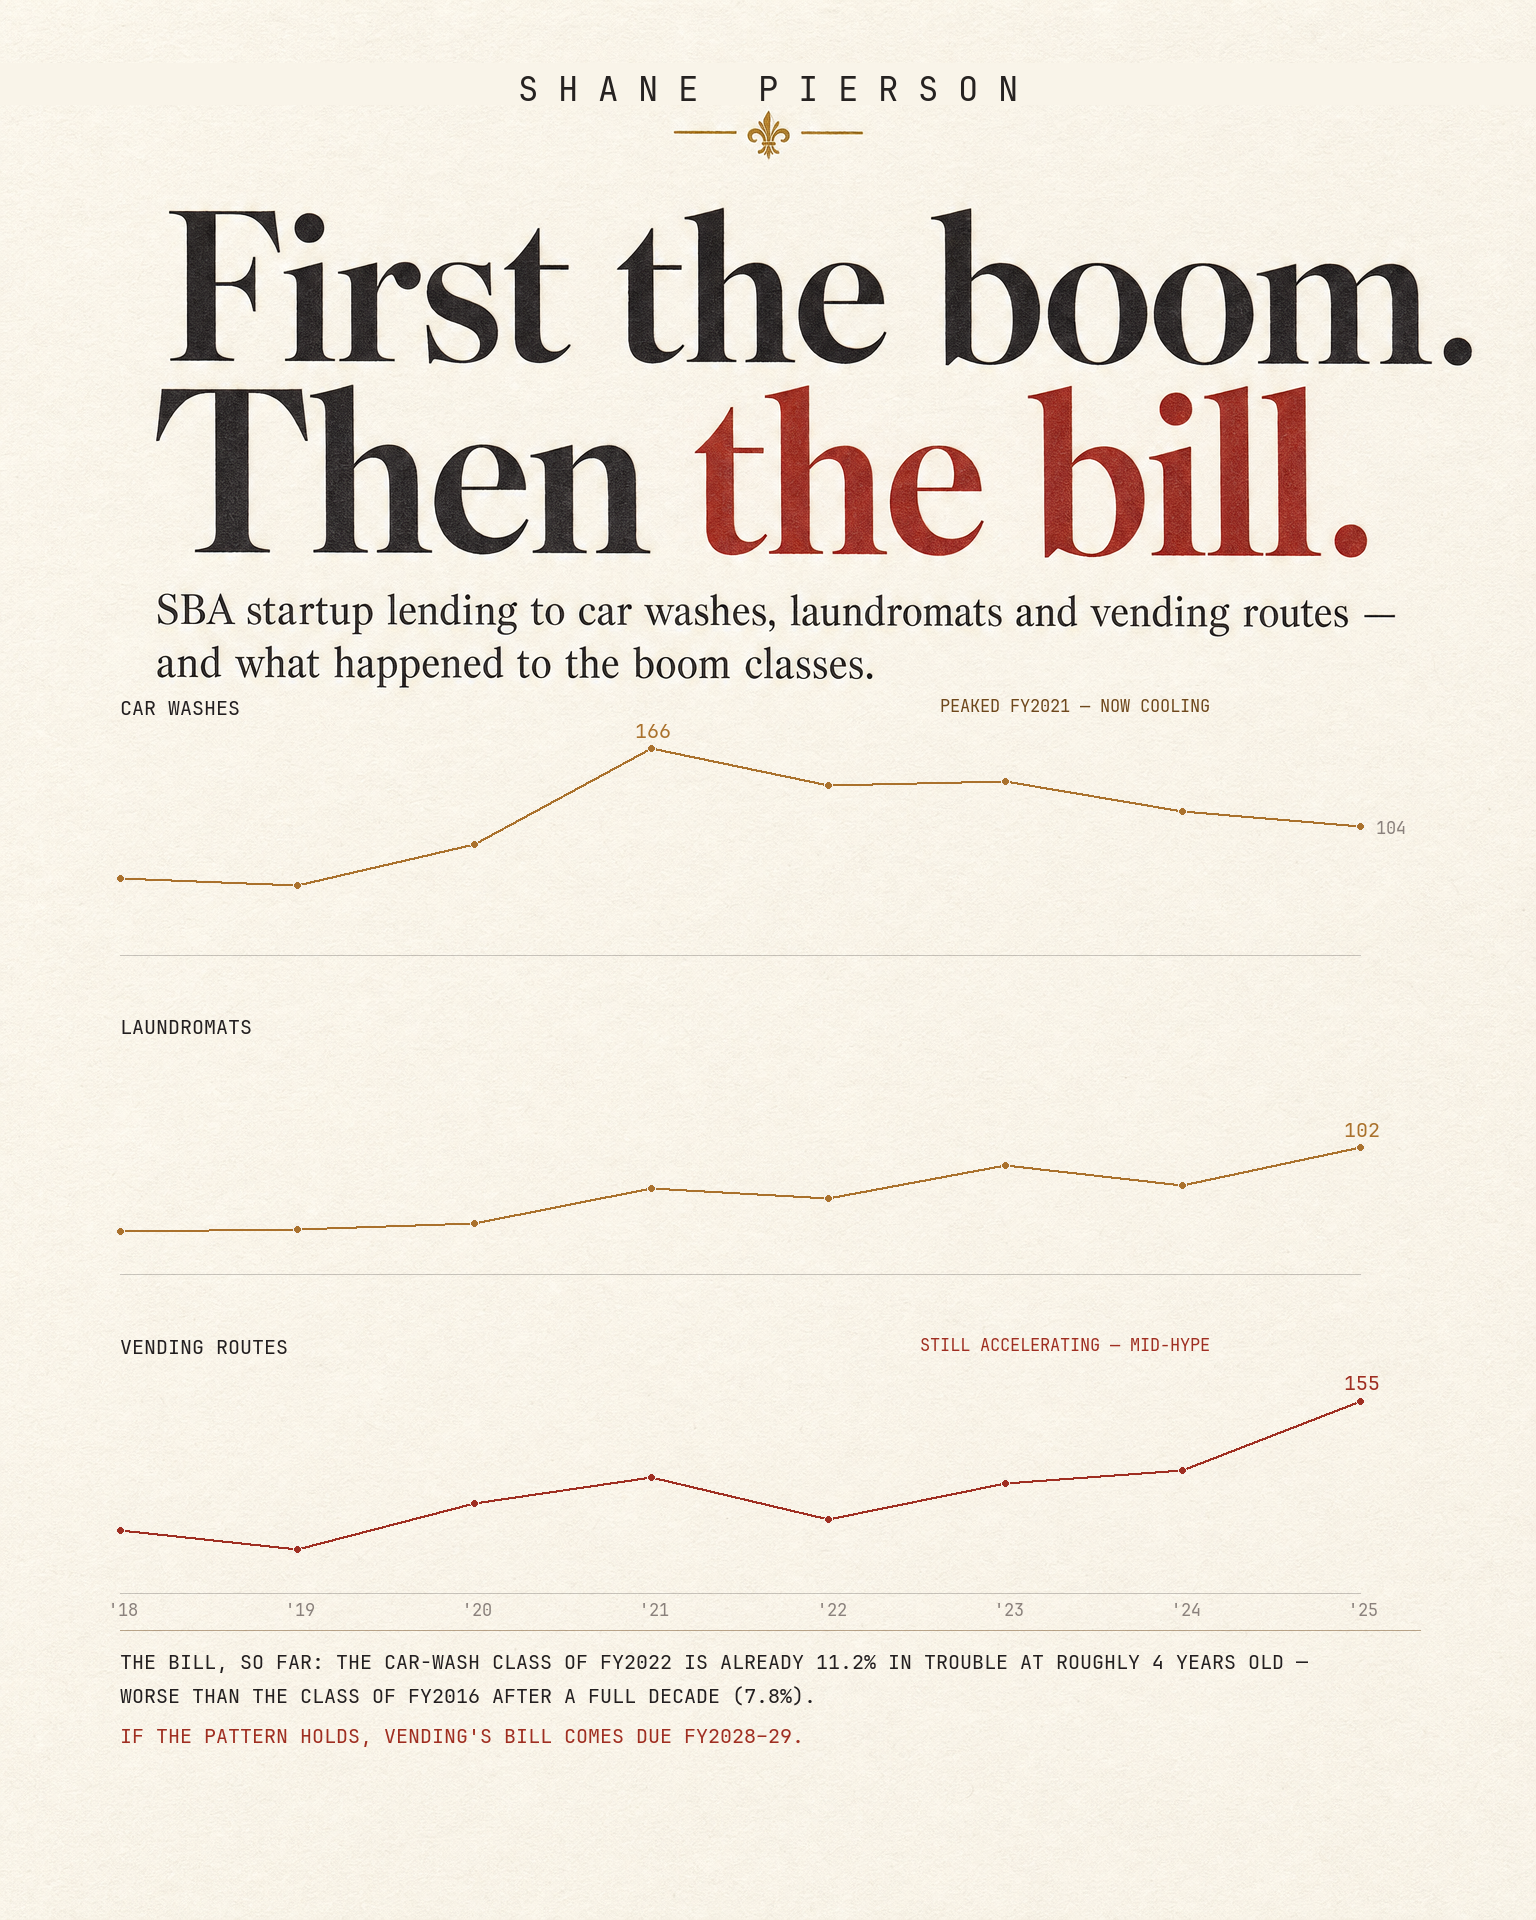
Every few years a small-business category catches fire on social media. The SBA loan data catches the smoke a few years later. Car wash, laundromat, and vending are the latest three sectors, each pitched hard as passive income, and each tracing the same boom-shaped startup-lending curve, just offset in time. The earliest of the three is already flashing an early, not-yet-conclusive sign that the bill is coming due.
CAR WASH FIRST
Car wash led this cycle. Startup and new-business 7(a) loan counts to the sector ran 62, 56, 89, 166, 137, 140, 116, 104 across FY2018 to FY2025. That's a sharp climb to a FY2021 peak of 166 loans, then a grind lower: 137, 140, 116, and finally 104 in FY2025, more than a third below the peak.
That peak landed in the years express-wash operators were being courted with cheap sale-leaseback debt and told the subscription-revenue model was recession-proof. The financing helped drive ZIPS Car Wash, one of the largest private-equity-backed rollups in the space, into Chapter 11 in February 2025, restructuring roughly $279M of debt against $654M in total obligations. Its own Chief Development Officer warned publicly of a "survival of the fittest" outcome in overbuilt trade areas. Car-wash M&A activity slowed too, per one industry tracker's count of deal volume in H1 2024 versus H1 2023.
THE EARLY READ
The loan data now shows something consistent with that overbuild. It's not yet proven. The full FY2022 car-wash loan class, 242 loans of every business age net of cancellations, is already 11.2% bad-status at roughly four years of seasoning, versus 7.8% for the class of FY2016 on the same basis after a full decade on the books. Filter the FY2022 class down to startups and new businesses alone and the figure is 10.2%.
Both figures are measured the same way: loans currently delinquent, past due, in liquidation, charged off, or purchased by SBA under its guaranty and not yet charged off. That fifth status carries real weight here, contributing 4.1 points of the FY2022 figure and 1.9 of the FY2016 figure, and some of those purchased loans could still cure. And the comparison is directional rather than a formal age-matched test: the FY2022 vintage still has years of seasoning left to run, its bad-status share will keep accruing, and this report's own methodology holds a true apples-to-apples version of this comparison for the next FOIA release, once the younger cohort has matured further. Treat the gap as a real early warning, not a settled verdict.
One more number belongs here because it cuts the other way. The sector's long-run track record is good. Across the matured FY2010 to FY2019 cohorts, car-wash loans charged off at 4.56% by count against 6.44% for all industries, and lost 1.22% of approved dollars against 2.93%. Historically, car washes have been better-than-average SBA credits. The thesis of this section is vintage concentration: boom-year classes deteriorating against their own sector's favorable baseline. That is what the FY2022 reading shows so far.
TWO STEPS BEHIND
Laundromat and vending sit behind car wash on the same curve, with more uncertainty in the read. Laundromat startup counts ran 35, 36, 41, 69, 61, 88, 72, 102 from FY2018 to FY2025, a dip to 72 in FY2024 followed by a climb to 102 in FY2025, the highest count in the series. On the raw numbers the laundromat wave hasn't crested yet.
Vending is the youngest of the three and, on those same raw numbers, the hottest: 51, 36, 73, 94, 60, 89, 99, 155. The jump from 99 loans in FY2024 to 155 in FY2025 adds 56 loans, the second-largest one-year count gain any of the three categories has posted since FY2018, behind only car wash's surge from 89 to 166 between FY2020 and FY2021, the move that marked its peak.
Part of that step-change may be a data artifact rather than pure demand. The sector's NAICS coding migrated from 454210 to 445132 during this window, and while the payload captures both codes, a reclassification effect on top of genuine growth can't be fully ruled out from the loan counts alone.
Vending machines are also the category most publicly associated with "passive income" side-hustle content marketed to people with no operating background. That's a plausible risk factor for underwriting quality, though the FOIA data has no borrower-experience field to test the link directly. It remains a hypothesis dressed in the surrounding public reporting, not a measured fact.
The charge-offs that would normally spread across a decade of ordinary-paced entry instead cluster into a two-to-three-year window once the marginal operators' working capital runs out.
WHY IT HAPPENS
The mechanism, where it holds, is straightforward. Marketing-driven demand pulls in a wave of first-time, thinly capitalized operators ahead of any real track record on unit economics. The charge-offs that would normally spread across a decade of ordinary-paced entry instead cluster into a two-to-three-year window once the marginal operators' working capital runs out.
That said, this section has one open structural gap worth naming plainly. Overall SBA startup and new-business loan counts grew from 9,897 in FY2018 to 23,254 in FY2025, a 2.35x rise, and these three category curves have not been netted against that base rate. A real possibility remains that some of this rise is just ordinary sectoral growth outpacing seasoning rather than a uniquely hype-driven pattern.
If the car-wash pattern holds, with roughly four years between car wash's FY2021 volume peak and vending's FY2025 surge, the vending charge-off wave should become visible in FY2028-29 vintage data. That's a dated, falsifiable prediction, not a certainty, and the next two quarterly FOIA releases will start to confirm or kill it.
THE BEAR CASE
This section has three real weak points, and here is where each one lands.
- No control group. Without a base-rate comparison to overall SBA startup-loan growth, or to a category with no hype narrative attached, "loan counts rose, then bad-status rose" is also consistent with ordinary sectoral expansion outpacing normal seasoning. That's an open limitation, not a resolved one.
- A favorable sector baseline. The disconfirming check was run against the FOIA file, and it holds: matured FY2010-19 car-wash cohorts charged off at 4.56% by count versus 6.44% for all industries, and lost 1.22% of approved dollars versus 2.93%. Car washes have historically been better-than-average SBA credits, so the thesis here survives only in its narrower vintage form, boom classes deteriorating against a good baseline, and it fails if the FY2021-22 classes season down to that baseline.
- Small counts. These are tens to roughly 160 loans a year per category, and this report holds larger categories to a statistical-significance standard, in Section 05, that isn't applied here. A "rolling over" versus "still climbing" read on a series this size is directional, not statistically tested.
This thesis would be wrong, or badly weakened, if:
- The FY2022 car-wash cohort's bad-status rate converges toward the FY2016 cohort's once both are age-matched.
- A base-rate check shows non-hype startup categories rising at a similar clip over the same years.
- The FY2025 vending jump collapses once NAICS-migration effects are held constant.
- The predicted FY2028-29 vending charge-off wave simply doesn't show up in the data.
FOR BROKERS
Car wash, laundromat, and vending deals sourced from social-media-driven demand deserve extra underwriting scrutiny right now. The car-wash data shows an early, real sign, though not yet fully proven, of faster-than-normal deterioration in its full FY2022 loan class, and vending is riding the same volume curve about four years behind. We're not writing off these sectors. First-time, thinly capitalized operators entering on a hype pitch are the population to underwrite hardest, and borrowers with real operating experience or existing locations in these categories aren't automatically painted by this pattern.
FOR BANKERS
Treat elevated recent-vintage volume in these three NAICS codes as a portfolio flag worth tracking separately, especially loans originated at or near each category's respective volume peak. The car-wash comparison isn't age-matched yet, and the vending number carries a NAICS-migration asterisk, so this is a monitoring signal, not a basis for blanket credit-policy changes today. The formal, age-matched read arrives with the next couple of FOIA releases.
WHAT TO WATCH
The next two quarterly SBA FOIA releases, for:
- Whether the car-wash FY2022 vintage's bad-status rate keeps outrunning the FY2016 vintage's on an age-matched basis.
- Whether laundromat startup counts, which printed a series high of 102 in FY2025, roll over the way car wash's did after FY2021.
- Whether vending's FY2025 jump to 155 holds or fades once NAICS-migration effects are held constant.
- On the multi-year horizon, whether a visible vending charge-off wave actually materializes in FY2028-29 vintage data, as this section's prediction requires.
SOURCES: SBA 7(a) FOIA data as of 3/31/2026, reconciled to SBA's FYE25 Activity Report · FOCUS Bankers: ZIPS Car Wash and the Cost of Private Equity Ambition, Car Wash Advisory: 2025 Car Wash M&A Report, NewsNation: Making Fast Money on Vending Machines: Is It That Easy?.
Same Loan, 195 Lenders, 195 Different Outcomes
Send the same borrower through 195 different SBA lenders and the charge-off odds will not match. They vary by an order of magnitude. Skill looks like the leading explanation. It is not the whole story, and one of the most aggressive small-balance books in the sample has already been forced out of the business.
THE SPREAD
We pulled every lender in the FOIA file with at least 300 matured loans. That gave us 195 institutions. For each one we built an expectation: what its charge-off rate should be, given the sector mix, loan-size mix, and program mix it actually wrote. Then we measured the gap between that expectation and what actually happened.
One disclosure before any names. The expectation model is our own, and respecifying its adjustment cells moves an individual lender's multiple by roughly 20 percent in either direction. Rank order holds up. The raw charge-off rates come straight from the public FOIA file and reproduce exactly, so we print them alongside every multiple.
The single best book in the sample belongs to Covington County Bank: 414 matured loans, zero charge-offs. Four more of the strongest performers sit close behind it, together underwriting 4,289 matured loans.
- D.L. Evans Bank
- German American Bancorp
- First Community Bank
- Enterprise Bank & Trust
That group of four charges off at roughly 0.1x-0.2x of what its own mix would predict. The worst tier runs roughly 2.6x-7.0x expectation.
One lender's book of 1,343 matured loans has charged off at 57%, the single worst result in the sample. That's not a typo. The figure reflects the currently assigned book, not necessarily who first underwrote it, so part of an outlier that extreme could reflect how a distressed book was acquired and marked down in bulk, not how each loan was written. We're withholding the lender's name pending a targeted public-record check.
SKILL OR TIMING
Underwriting discipline is the strongest explanation for this spread, but the model can't fully separate it from timing luck. It adjusts for sector, size, and program. It doesn't adjust for when a book was originated, and this report's own vintage-curve data (Section 02) shows three-year charge-offs swinging from 1.1% to 14.5% purely on cohort timing. Two lenders with the same sector, size, and program mix can still be holding very different vintages, so some of what looks like a skill gap is really a calendar gap.
There's a coverage limit the payload never states outright: this sample only includes lenders that reached 300 or more matured loans in a given cell. Any book that failed, got acquired, or exited SBA lending before hitting that volume never shows up here. The true range across every lender that has ever done SBA lending could be wider than what we can show.
THE SPEED MACHINES
One pattern survives even after we correct for mix: the high-volume, small-balance origination machine. BayFirst, Celtic, and TD run three of the biggest books of this kind in the sample, and all three charge off well above what their own sector, size, and program mix predicts, even after the adjustment already strips out the fact that small, fast loans carry more risk than large relationship loans.
The label matters here. Only TD is a true Express shop; roughly 92% of its matured book ran through the Express program family. BayFirst and Celtic wrote almost no Express loans. They built their volume under Preferred Lender and Small Loan Advantage authority, 99% and 95% of their matured books respectively. And the Express product itself is fine: across all lenders, Express loans charge off slightly below their sector-and-size expectation, roughly 0.85x-0.95x depending on specification. The excess lives in specific lenders rather than in any program code.
- BayFirst: 20.3% of 3,889 matured loans charged off, roughly 2.4x-2.6x its mix expectation.
- Celtic: 17.8% of 6,916, roughly 2.0x-2.5x expectation.
- TD: 13.8% of 13,822, roughly 1.9x-2.1x expectation. Better than the other two, still well above its own mix.
That the excess survives the adjustment rules out one easy explanation. Speed alone doesn't explain it. The data can't say whether the cause is looser origination standards, thinner post-close servicing, or adverse selection toward borrowers who needed speed because they'd already been declined or were under stress elsewhere. All three are plausible, and none rules out the others. Speed is being paid for somewhere in these books, and the ledger doesn't say by whom.
Speed is being paid for somewhere in these books, and the ledger doesn't say by whom.
BAYFIRST'S EXIT
BayFirst's own 2025 disclosures add real texture. The bank discontinued its branded "Bolt" small-balance 7(a) product in August 2025, after 2022 and 2023 vintages soured under the rate shock. It then sold its roughly $103M SBA 7(a) book to Banesco USA and exited the business entirely by Q4 2025. Public coverage describes Bolt as at least as fast as SBA Express. Structurally it was a different animal: Bolt carried an 85% guaranty, where SBA Express carries 50%, strong evidence those loans sat inside the standard 7(a) Preferred Lender book our BayFirst figure is built from. The high-volume small-balance model deteriorated, and the lender that ran it hardest left SBA lending.
Celtic is telling a different story. It is scaling the same high-volume small-balance model with an AI origination partner. Either the market hasn't priced this risk yet, or Celtic's underwriting is better within the same model. Our data can't tell the two apart without Celtic-specific performance disclosures we don't have.
WHO HOLDS THE RISK
A second structural theme is who holds the risk once a loan is booked. Lender figures in this dataset reflect the currently assigned book, not necessarily the originator, and the secondary market's reach has widened at the small end. By loan count, 32.1% of FY2025 approvals were sold to the secondary market, up from 28.5% in FY2022. Dollar-weighted, the sold share actually eased over the same window, from 45.9% to 42.6%, so the growth is concentrated in smaller loans. Some individual books sell 76% to 94% of what they originate.
Selling the guaranteed portion is standard SBA practice and a documented source of fee income. Still, who originated a loan and who is exposed to it today are increasingly different questions. There's a less one-sided angle here too. Guaranty sales pay the seller a premium up front, which gives even disciplined lenders a rational reason to sell. A rising sold count fits smart balance-sheet management just as well as it fits an industry trading hold-to-maturity discipline for volume. The assigned-book data alone can't tell the two apart.
THE THROUGHLINE
Line this up against the fast-grower finding elsewhere in this report (Section 02). Lenders whose books doubled in two years saw their next vintages charge off at 1.6x the rate of steady-growth peers. Even with every hedge above, the throughline holds: performance dispersion across lenders is large, and it persists across cohorts. Mix alone doesn't explain it. It just isn't one clean number, and it isn't proof of process quality on its own, apart from timing, selection, and market structure.
THE BEAR CASE
The strongest attack on this section is that the dispersion is partly an artifact of what the expectation model can't see.
- Vintage-mix timing.
- Survivorship: failed or acquired books never reach the 300-loan threshold needed to appear here at all.
- Adverse borrower selection into fast-approval products.
- Model specification: the expectation cells are our own choice, and respecifying them moves an individual multiple by roughly 20 percent.
Each of those is real, and none can be fully ruled out with this payload alone. The BayFirst case is suggestive. It is not conclusive: the exit confirms one lender's small-balance book went bad, and its raw 20.3% charge-off rate reproduces exactly from the public file, but the adjusted multiple around it is still our model's output. This thesis would take a real hit under any of three conditions.
- A loan-level, vintage-adjusted re-run collapses most of the best-to-worst spread.
- A targeted FDIC record check shows the 57% outlier was a bulk post-acquisition markdown, not organically written bad loans.
- Celtic's SBA book, scaling the same high-volume small-balance model BayFirst just exited, turns out to perform fine over the next several vintages.
Until one of those checks runs, treat the dispersion as directionally real and lender-level. It is not yet a precise, fully causal skill ranking.
FOR BROKERS
Lender selection is a real decision, not a formality. Routing a deal to a below-median book on this measure changes the credit quality of what you're placing. Be deliberate with high-volume small-balance lenders. The excess risk there survives the size adjustment, so speed is being paid for somewhere. It's worth asking whether that's origination standards, servicing, or the borrower profile you're bringing them.
FOR BANKERS
Benchmark your own book against sector, size, and program expectation, not against a raw peer-group charge-off rate. Before you conclude you have a skill problem or a skill edge, check how much of the gap is really vintage timing. If you're growing sold-share, be ready to say whether that's disciplined balance-sheet management or volume covering for underwriting you haven't stress-tested.
WHAT TO WATCH
- The next quarterly SBA FOIA release, for whether the best-to-worst dispersion persists as more vintages mature.
- A targeted FDIC BankFind or enforcement-action check on the 57%-charge-off lender, before any public naming.
- Celtic's SBA performance disclosures, as its AI-origination partnership with Casca scales the high-volume small-balance model.
- Any further SBA action on lender categories, following the 2025 Community Advantage moratorium and capital-reserve changes.
SOURCES: SBA 7(a)/504 FOIA data as of 3/31/2026, reconciled to SBA's FYE25 Activity Report · Florida's BayFirst sheds 51 jobs, shutters SBA loan platform (Banking Dive), $103 Million SBA Loan Portfolio: BayFirst Financial's Strategic Exit (StockTitan), BayFirst Discontinues Bolt SBA 7(a) Loan Program (GlobeNewswire), Casca Selected by Celtic Bank to Power Its SBA Lending Program (PR Newswire), SBA Overhauls Reckless Biden-Era Lending Program (SBA.gov), SBA Bolt Loans (Lendio).
On July 4, 2026, SBA Cracks Open a $10 Million Door
For the first time since 2010, SBA is raising the combined ceiling on how much one borrower can carry across 7(a) and 504 loans. More important, it's decoupling how the two programs count against each other. The mechanics here are real and independently confirmed. The headline capacity number built on top of them is not, and that gap is the story.
THE MECHANICS, CONFIRMED
Since 2010, a borrower's 7(a) and 504 exposure have shared one ceiling, and they still do until the notice takes effect. The two programs count against each other. Draw down a 504 debenture to buy a building, and your 7(a) headroom shrinks right along with it.
SBA Policy Notice 5000-879058, published May 18, 2026 and effective July 4, breaks that coupling in one direction. SBA's own release confirms it plainly. 7(a) loan balances no longer reduce the maximum loan amount available under the 504 program. From July 4, a borrower can stack a full 7(a) facility and a full 504 project without either one crowding out the other, up to a combined $10 million.
The all-programs guaranty cap on the 7(a) side hasn't moved, and it still binds no matter how you sequence a deal. That's $3.75 million per borrower and its affiliates, $4.5 million for qualifying export loans. Both figures sit verbatim in the notice text, which quotes 15 U.S.C. 636(a)(3)(A). One trade summary of the notice puts the export cap at $4.75 million; the statute and the notice say $4.5 million.
WHO ACTUALLY QUALIFIES
Run against the FOIA book, the clearest, best-supported beneficiary population is 86,984 active 7(a)-only entities, counted within a defined screen of eight industry groups where owning the building is common, from healthcare and repair shops to restaurants and lodging. These businesses already used 7(a) and never touched a CDC. Under the confirmed 7(a)-does-not-reduce-504 mechanic, from July 4 they sit on full, fresh 504 capacity the old shared ceiling kept out of reach.
That's the section's most defensible number. The direction of the rule change behind it is stated plainly in SBA's own release, no reading between the lines required.
THE BIGGER, SHAKIER NUMBER
The payload also models a second, larger figure: an estimated $219 billion of 7(a) gross capacity across 51,742 clean-history, 504-only borrowers, a median of roughly $4.5 million each. The model is more careful than the headline sounds. It nets each borrower's estimated outstanding debenture against the $3.75 million guaranty cap, amortizes at a deliberately slow rate so balances stay high and headroom stays understated, and drops anyone below $500,000 of estimated capacity. Read the total as an eligibility envelope. The shaky part is the word new.
Whether that capacity actually opens on July 4 depends on the reverse direction of the decoupling, the mirror image of the confirmed rule. Does an existing 504 balance still reduce a borrower's 7(a) maximum? We pulled the notice text itself. It is explicit that 7(a) balances no longer reduce 504 maximums, and silent on the reverse. NAGGL's quotation of the notice runs the same single direction. Trade coverage splits, with some outlets reading the change as bidirectional and others reading it as one-way.
One thing holds under every reading. The notice keeps the $3.75 million guaranty cap defined on a borrower's total outstanding SBA-guaranteed balance across all programs, so 504 exposure nets against 7(a) headroom regardless, and the model already builds that in; no borrower in the file shows a flat $5 million. What an adverse reading would change is the unlock itself. If the 504-to-7(a) direction still works the way it always has, little of this capacity is genuinely new on July 4, and the unlock story falls back to the 86,984-entity, 504-side population. Treat $219B as the upper bound of the favorable reading. It's worth pursuing. It is not worth quoting to a customer as a settled figure. The caveat the payload itself flags, eligibility headroom rather than demand, applies doubly here.
Real headroom exists, but its size is not yet a settled number.
THE NICHE PLAYS
Narrower niches sharpen the picture without inheriting that ambiguity. They describe project-level limits, not the cross-program calculation, so none of the uncertainty above touches them:
- Energy public-policy 504 projects can aggregate to $16.5 million, a cap the notice restates rather than creates. It came back with SOP 50 10 8 in June 2025.
- Small manufacturers can add roughly $5.5 million per additional project.
- The notice makes explicit that a borrower can run multiple simultaneous 504 projects.
That's a structural gift to capital-intensive, asset-heavy operators specifically, independent of how the 51,742-borrower question resolves.
SEQUENCING GAME
Sequencing matters more than the clean-path framing suggests. The confirmed mechanic holds that 7(a) balances don't reduce 504 capacity, but 504 exposure still counts against the shared $3.75M/$4.5M guaranty cap. That means a 7(a)-first order of operations reaches more of the $10 million than 504-first does.
Trade coverage of the notice goes further than a pure optimization argument. Some sources describe closing 7(a) first, or alongside 504, as close to a structural requirement of the stacked-deal mechanics. Brokers structuring a stacked deal should confirm the exact sequencing rule against SBA guidance and lender counsel before treating 504-first as merely a weaker option rather than a foreclosed one.
Lenders positioned for CDC-and-7(a) combination deals have an obvious incentive here. Originate the working capital and equipment through 7(a) ahead of the facility purchase through 504. That's the workflow the notice's economics point toward. Read it as our inference, not as an attributed industry quote.
SCALE, THEN PRICE
Two forces will determine how much of this theoretical capacity turns into actual originations. First, scale. Independent data from NerdWallet, citing SBA's fiscal 2026 segment data, shows only 6.8% of 7(a) borrowers receive loans larger than $2 million; in the full FY2025 FOIA book the share was 5.5%. The average 7(a) loan to a business with five or fewer employees is $377,192, less than a tenth of even the old $5 million combined cap.
None of that undercuts the eligibility-headroom math. It describes existing 504-only and 7(a)-only borrowers who are already bigger, asset-heavier operators than the median applicant. Still, $219B and 130,000+ eligible relationships describe an atypical, already-larger slice of the SBA book than the borrower base as a whole.
Second, price. The all-in effective rate on a 25-year 504 loan sits near 6.1% as of June 2026, down modestly from 6.4% a year earlier; the raw June debenture priced at 4.98% before servicing fees paid to the CDC, SBA, and the central servicing agent. The effective rate still sits well above the 2021 lows, which ran from roughly 2.4% to 2.8% depending on the CDC. Mid-cycle rates are neither a tailwind nor a binding constraint on stacking. They leave uptake as a behavioral question that the FOIA data, not the notice, will eventually answer.
THE BEAR CASE
The rule change itself is not in dispute. The notice text, SBA's own release, and NAGGL's summary all confirm 7(a) balances no longer reduce 504 capacity, effective July 4, 2026. American Banker reports it as the first increase in the cumulative limit since 2010.
What's in dispute is the section's biggest number. The $219B/51,742-borrower 7(a)-headroom figure assumes the reverse direction of decoupling, that existing 504 balances no longer gate a borrower's 7(a) maximum. The notice text is silent on that direction, and trade coverage splits on it. The guaranty-cap netting is already in the model; the bidirectional reading is the unconfirmed part.
This thesis would need a full rewrite of its central number if SBA clarifies that 504 exposure still limits 7(a) capacity the way it always has. In that case, most of the 51,742-borrower population would see little or no genuinely new 7(a) capacity, and the true unlocked figure would sit closer to the 86,984-entity, 504-side population alone.
Until SBA spells out the 7(a)-side maximum-loan-amount calculation, in the SOP or a follow-up notice, hold the $219B figure as a provisional, favorable-reading upper bound. Real headroom exists, but its size is not yet a settled number.
FOR BROKERS
The confirmed opportunity is with 7(a)-only clients in building-ownership industries. From July 4 they qualify for full, fresh 504 capacity, full stop. For 504-only clients, work the per-borrower math and leave the aggregate out of the pitch. Headroom is ($3.75M, or $4.5M for export, minus estimated outstanding SBA exposure) divided by the guaranty rate, capped at $5M gross. That same formula sits behind the $219B model, and it shrinks fast for anyone carrying real 504 debt. Whether any of that headroom is genuinely new hangs on the unresolved 504-to-7(a) direction. Sequence deals 7(a)-first, and confirm the exact requirement with counsel before assuming sequencing is optional rather than required.
FOR BANKERS
Standard underwriting hasn't changed. This notice moves the ceiling. It doesn't touch the credit box. Build pipeline against the 86,984-entity 7(a)-only/building-ownership population with confidence. Treat the 504-only/7(a)-headroom population as a research priority until SBA confirms the calculation language; it is not ready to be a marketing number. Watch 504 pricing, an effective rate near 6.1% and still well above the 2021 lows, as the practical throttle on how many eligible borrowers actually stack.
WHAT TO WATCH
- SBA clarification of the 7(a)-side maximum-loan-amount calculation, in the SOP or a follow-up notice, specifically whether outstanding 504 balances still reduce new 7(a) capacity. The notice text is silent on it, and that single answer would resolve this section's largest open issue.
- SBA or NAGGL clarification on whether 7(a)-first sequencing is a structural requirement or just an optimization.
- The FOIA release covering the quarter ending September 30, 2026, the first with post-July-4 originations in it, for the first real read on stacked-deal volume. The 6/30/2026 release closes before the rule takes effect, so it cannot show uptake.
- Movement in the effective 504 rate from its current level near 6.1%, which will govern how much of the eligible population actually pulls the trigger.
SOURCES: SBA 7(a)/504 FOIA data as of 3/31/2026, reconciled to SBA's FYE25 Activity Report (clean-history borrower counts, headroom modeling) · SBA: "SBA Doubles Cumulative 7(a) and 504 Loan Limit to $10 Million", NAGGL: SBA Policy Notice Clarifying Maximum Loan Limits for 7(a) and 504, American Banker: SBA Raises Cumulative Loan Cap for First Time Since 2010, NerdWallet: The SBA Loan Limit Is Doubling, But It Won't Matter for Most Small Businesses.
Four Calls, Made to Be Proven Wrong
This section breaks from the previous nine. The other nine described what already happened across 78,078 FY2025 loans. This one runs the patterns forward, on the record, with dates attached. Four calls follow, in the order they resolve, and each one is written so a specific future data point can prove it wrong.
Most of these calls resolve against the next quarterly FOIA release, dated 6/30/2026. That release will be the first ever to let this series measure delinquency as a flow rather than a stock, because the loan-level status field only entered the public data on 3/31/2026. One limitation runs under everything that follows. Where a call rests on a single snapshot rather than a trend, we say so.
THE FLOOR RISES
The first call is closer to arithmetic than forecasting. FY2025's 16.6% cancellation rate is not final. 5,491 pending commitments are still working through the pipeline, and a pending loan resolves to either funded or cancelled. It never goes back to a clean approval.
Barring data revisions between releases, the rate can only rise from here. We include it anyway, because most readers will anchor on 16.6% as a finished number when it is really a floor.
TRANSPORT'S BAD BET
The second call is a sector-persistence bet, and we are stating the caveat up front instead of burying it. Transport's 10.86% active-book distress reading is the worst of any sector measured. Under the same definition (loans delinquent, past due, or in liquidation, as a share of the active book), the system-wide rate is 6.0%, so transport runs at nearly twice the book. That number also comes from one status snapshot rather than a trend line. This series cannot yet tell a persistent condition apart from a point-in-time reading.
That distinction only becomes possible at the 6/30/2026 release, the first one that will show whether the number is rising, falling, or holding flat. We expect transport to keep the #1 ranking through at least the next two releases, on the reasoning that distress concentrated in structurally impaired freight capacity does not clear in one quarter. That reasoning is a prior, though, not a verified freight-market data point. It should carry that discount until an external freight-cycle source checks it.
A pending loan resolves to either funded or cancelled. It never goes back to a clean approval.
THE NEXT WAVE
Third is the hype-cycle call carried over from Section 7. Three sectors are moving through the same cycle at different speeds.
- Car washes peaked at 166 startup loans in FY2021 and have trended down since, to 104 in FY2025. The full FY2022 car-wash class (all loans, n=242) is already showing elevated stress: 11.2% bad-status (delinquent, past due, in liquidation, purchased by SBA but not yet charged off, or charged off) at roughly four years of seasoning, versus 7.8% for the FY2016 class after nine.
- Laundromats hit a new startup high of 102 loans in FY2025, though the path is choppy: 88 in FY2023, then a dip to 72 in FY2024.
- Vending posted 155 startup loans in FY2025, up from 99 the year before. That jump is a single year of data.
If the car-wash pattern holds (a startup-volume peak, then a charge-off wave roughly four years behind it), and FY2025 proves to be vending's peak, the wave lands FY2028-29. We are dating it that specifically so it can be proven wrong on schedule.
THE FAST-GROWER ECHO
Fourth, and highest-stakes, is the fast-grower echo. Section 2 showed that lenders whose books doubled in two years produced meaningfully worse paper. In the one clean backtest available (FY13 to FY15 growers, FY2015-16 vintages), those fast growers charged off at 9.52%, against 5.93% for steady growers. That is a 1.6x gap.
FY2025's fast-grower share sits at 25.8% of loan count (the metric is a count share, computed on the full annual series). One hot year on its own means little. Single-year spikes in FY2011 (22.1%) and FY2015 (24.8%) passed without producing a 2007-scale vintage, and FY2024's 32.4% ran higher than this year's reading. The signal is the run. FY2023 through FY2025 printed 23.7%, 32.4%, and 25.8%, three straight years above 22%. The only other three-year stretch like that in the series is 2005-07 (25.2%, 24.2%, 22.3%), the run-up to the worst vintage in its 32-year history: FY2007, at 14.46% three-year charge-off.
NOT A REPEAT OF 2008
Here is the forecast. Given the three-year run, we expect the FY2025-26 vintages' eventual 3-year charge-off to exceed the FY2016-19 band of 2.1-2.3% by roughly 2x. FY2026's reading sharpens or softens the FY2026 half of that call: a fourth straight year above 22% strengthens it, and a drop back toward the quiet readings of FY2019-20 (4.7% and 3.3%) softens it. The forecast is directionally consistent with the 1.6x backtest, though it doesn't follow strictly from it. The backtest is a single lender-cohort, single-window instance, and should be weighted that way.
This is not a GFC-scale forecast. Today's fast-grower cohort includes new SBLC charters and fintech entrants that inflate the metric in ways the 2005 cohort didn't. Correlation across two eras with different underwriting regimes is a weak instrument on its own. The exit condition is specific. The FY2025 vintage was originated inside the hot run, so its three-year charge-off tests the thesis directly. If that number lands inside the FY2016-19 band of 2.1-2.3%, this echo thesis is wrong, and we will retire it.
WHAT SITS UNDERNEATH
One structural fact sits underneath all four calls. Capital intensity is diverging by sector. PPI-deflated real capital intensity is running +20% for healthcare startups, against +4% for restaurants (an internal derived metric; the deflator series sits outside the public extract). Healthcare separately carries the second-cleanest distress reading in the book, 4.07% behind finance's 3.20%, sitting almost exactly on its 4.09% matured charge-off baseline. Both readings are real. Neither proves the first causes the second. Composition cuts both ways here. Relative to restaurants, healthcare runs far lighter on true startups (34.8% of FY2024-25 loans against 47.3%), and that mix gap alone could explain part of the capital-intensity spread. Against the whole book the story flips: healthcare's startup share exceeds the 30.9% system-wide rate, and its Change of Ownership share (8.2%) sits below the system's 9.5%, so an established-practice skew cannot explain the clean distress reading.
The acquisition channel tells its own story. Change of Ownership loans hit a record 7,532 loans and $8.8B in FY2025, capital flowing toward buying existing cash flow rather than funding new risk.
CAPACITY IS THE CEILING
Macro trends complicate the picture too. The Kansas City Fed's bank-side lending survey shows new small-business lending up 13.4% year over year as of Q3 2025. On the borrower side, the Fed's 2026 Small Business Credit Survey found 42% of employer-firm applicants received the full financing they sought. Those are different instruments on different clocks, a bank survey and a firm survey, and they are read separately here. At the same time, the NFIB optimism index fell to 95.3 in May 2026, the third straight month below its 52-year average, with its Uncertainty Index at 91.
Capacity is the piece that touches everything else in this report.
- SBA's 7(a) program level held at $35B from FY2023 through FY2025. The FY2026 enacted level moved to $35.5B under the Consolidated Appropriations Act, 2026.
- NAGGL had pushed for $38-40B; the enacted number landed well below that ask.
- The Administrator holds standing authority to raise the ceiling up to 15% without new legislation.
The half-billion raise does not clear the constraint. FY2025 approvals ran $37.3B gross ($32.4B net of cancellations) against a $35B ceiling, and the FY2026 ceiling sits only modestly higher. Capacity remains a real constraint on every volume-growth call in this report.
THE BEAR CASE
The weakest links here are the ones already flagged in the prose. A skeptic would not need to surface new ones. Transport's persistence call rests on one status snapshot. If the 6/30/2026 release shows the reading falling rather than holding, this call breaks on schedule, exactly as intended.
Next is the fast-grower echo, a directional bet rather than a magnitude-bounded one. It stands on a single-cohort, single-window backtest, and a bank credit committee is right to discount it until the FY2028-29 vintage-maturity data can test it directly.
The volume-growth framing running through this whole report is also less independent than it looks. SBA's 7(a) program level for FY2026 is $35.5B, a half-billion raise after three years at $35B, while FY2025 approvals already ran $37.3B gross ($32.4B net of cancellations). If demand keeps outrunning that ceiling faster than the Administrator's 15%-safety-valve authority can absorb it, approvals get rationed for capacity reasons that have nothing to do with credit quality. A flat FY2026 would then read as evidence of a supply constraint, and nothing more.
Three things would falsify this section outright.
- Transport distress falls at the next release.
- The FY2025 vintage's three-year charge-off lands inside the FY2016-19 band of 2.1-2.3% despite the hot run.
- FY2026-27 approval volume flattens for reasons traceable to the $35.5B ceiling rather than softening demand.
Any one of those breaks a load-bearing piece of this forward view.
FOR BROKERS
Underwrite the fast-grower risk explicitly when placing paper with lenders whose assigned book has doubled in the past two years. The FY13 to FY15 backtest says that growth rate alone predicts materially worse charge-off, independent of individual borrower quality. The new combined $10M 7(a)/504 door (Section 9) goes live July 4, 2026, right as the Change of Ownership channel hits record volume ($8.8B in FY2025). That pairing is the highest-conviction near-term opportunity in this report. Treat transport placements with caution. The distress reading is real, even though the persistence call is not yet proven.
FOR BANKERS
At the portfolio level, the fast-grower echo argues for tighter growth-rate covenants and enhanced monitoring on any book scaling faster than 2x in two years, applied beyond just individual-credit scrutiny. Healthcare's rising capital intensity, paired with its clean distress reading, is a genuine underwriting opportunity. Don't price in causality, though. The distress reading is a single snapshot, and healthcare's borrower mix runs more startup-heavy than the system average, so composition does not explain the clean number away. Plan too for the possibility that SBA's $35.5B FY2026 program level becomes a real supply constraint before the fiscal year closes. A rationing scenario would compress approval timelines and volume independent of your own credit decisions.
WHAT TO WATCH
The next quarterly FOIA release, dated 6/30/2026 and due around Q3, is the single most important marker in this report. It is the first point where delinquency becomes measurable as a flow rather than a stock, and the first real test of the transport-persistence call. Watch alongside it:
- 504 month-bucket migration data.
- The release after it, dated 9/30/2026, brings the first uptake data on the $10M combined door: the rule takes effect July 4, 2026, after the 6/30 data window closes, so the 6/30 release cannot show it.
- Whether FY2026 approvals press against the enacted $35.5B program level, and whether SBA reaches for the Administrator's 15% headroom.
- Cass Freight Index or FreightWaves reporting on the freight recession, external to the FOIA series, which would meaningfully strengthen or undercut the transport call this section could not independently verify.
SOURCES: payload s10-outlook (FOIA-derived predictions, structural stats, caveats) · NFIB Small Business Economic Trends report, NFIB optimism falls to 95.3 · Self Employed, Goldman Sachs · why the Fed is unlikely to cut rates this year, Federal Reserve FOMC projections, June 17 2026, Kansas City Fed Small Business Lending Survey, Q3 2025, Federal Reserve Banks · 2026 Small Business Credit Survey, Report on Employer Firms, CRS R43846 · SBA funding, overview and recent trends, American Banker · demand for SBA loans rises, main program may reach ceiling
Every number has a receipt.
This report is computed, not curated. Each figure traces back to a hashed federal source file and a query anyone could rerun.
The data. U.S. SBA 7(a) and 504 FOIA files as of March 31, 2026. That is 2,174,502 loan records covering FY1991 through the first half of FY2026, downloaded from data.sba.gov with SHA-256 manifests. The March 2026 release is the first to carry loan-level status detail. Rate history comes from the Federal Reserve's Prime series (FRED MPRIME) and inflation adjustments from PPI All Commodities (FRED PPIACO), joined at the month each loan was approved.
The reconciliation. Our FY2025 totals match SBA's official year-end activity report to the exact loan: 78,078 loans, $37.29 billion. Analysis that cannot reconcile to the agency's own numbers does not ship.
The discipline. A few rules run through everything here:
- Default comparisons use matured cohorts (FY2010 to FY2019) or explicit vintage curves. Raw rates across mixed ages never appear.
- Small samples are suppressed: at least 150 loans per franchise brand, 300 per lender, 30 per rate cell.
- Franchise brands are merged under a reviewed alias map, and every brand rate carries a 95% confidence interval.
- Lender performance is measured against what each lender's own mix of industries, loan sizes and programs would predict.
- Lender figures describe the book currently assigned to that lender, since loans transfer between institutions.
The language. Figures describe SBA-approved loans, and approval is not funding. A charge-off is an accounting event, not proof a business failed. Jobs figures are borrower-reported. Capacity figures are eligibility estimates, not demand. Every forward-looking statement carries a date and a condition that would prove it wrong.
The review. Each section was drafted by an analyst, attacked by an independent reviewer hunting for confounds and overreach, then rewritten to keep only what survived. The bear case lives inside each section, not in a footnote.
ENGINE: SHANE PIERSON · SBA DATA ENGINE · DATA.SBA.GOV 7(a)/504 FOIA · FRED MPRIME & PPIACO · SBA FYE25 ACTIVITY REPORT · SBA POLICY NOTICE 5000-879058